Documentation / Tutorials / Test your first page
Test your first page and read the report
In this tutorial you run your first test, open the HTML report and learn what the most important parts of it tell you. At the end you test your own page.
You need:
- Docker installed and running.
- A terminal.
- About 10 minutes.
Step 1: Run the test
Open a terminal, go to a folder where you want to keep the result and run:
docker run --rm -v "$(pwd):/sitespeed.io" sitespeedio/sitespeed.io:43.0.0 https://www.sitespeed.io/On Windows in PowerShell, use ${pwd} without quotes:
docker run --rm -v ${pwd}:/sitespeed.io sitespeedio/sitespeed.io:43.0.0 https://www.sitespeed.io/The first time, Docker downloads the sitespeed.io container (about 1 GB). Then sitespeed.io:
- Opens Chrome inside the container.
- Loads the page three times. Each load is a run. It records a video of each run.
- Collects the metrics and writes the HTML report.
The test takes less than a minute. The last line in the terminal tells you where the report is:
INFO: HTML stored in /sitespeed.io/sitespeed-result/www.sitespeed.io/2026-11-16-07-02-34
/sitespeed.io is the folder you ran the command in, so the report is in sitespeed-result/www.sitespeed.io/<date-and-time>/ in that folder.
Step 2: Open the report
Open index.html in the result folder in your browser. On a Mac you can run open sitespeed-result/www.sitespeed.io/*/index.html.
The first page is the summary of all the pages you tested. You tested one page, so you see one result.
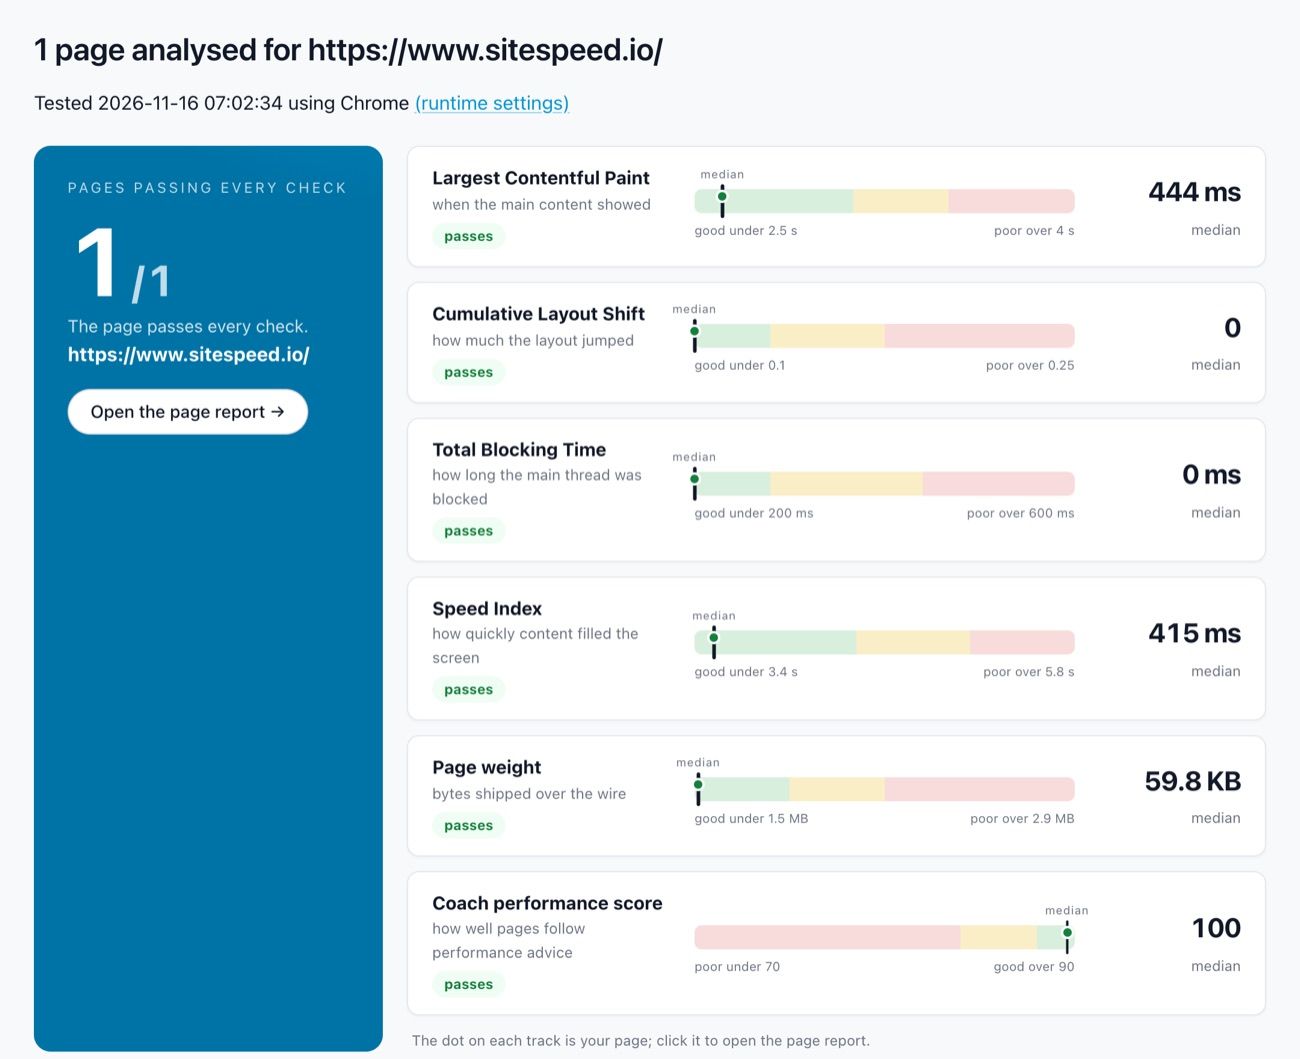
Each card is one metric: the Core Web Vitals Largest Contentful Paint, Cumulative Layout Shift and Total Blocking Time, then Speed Index, the page weight and the Coach performance score. The bar shows the good (green), needs improvement (yellow) and poor (red) ranges, and the dot is your page. The value is the median of the three runs.
Click Open the page report.
Step 3: Read the page summary
The page report opens on the Summary tab.
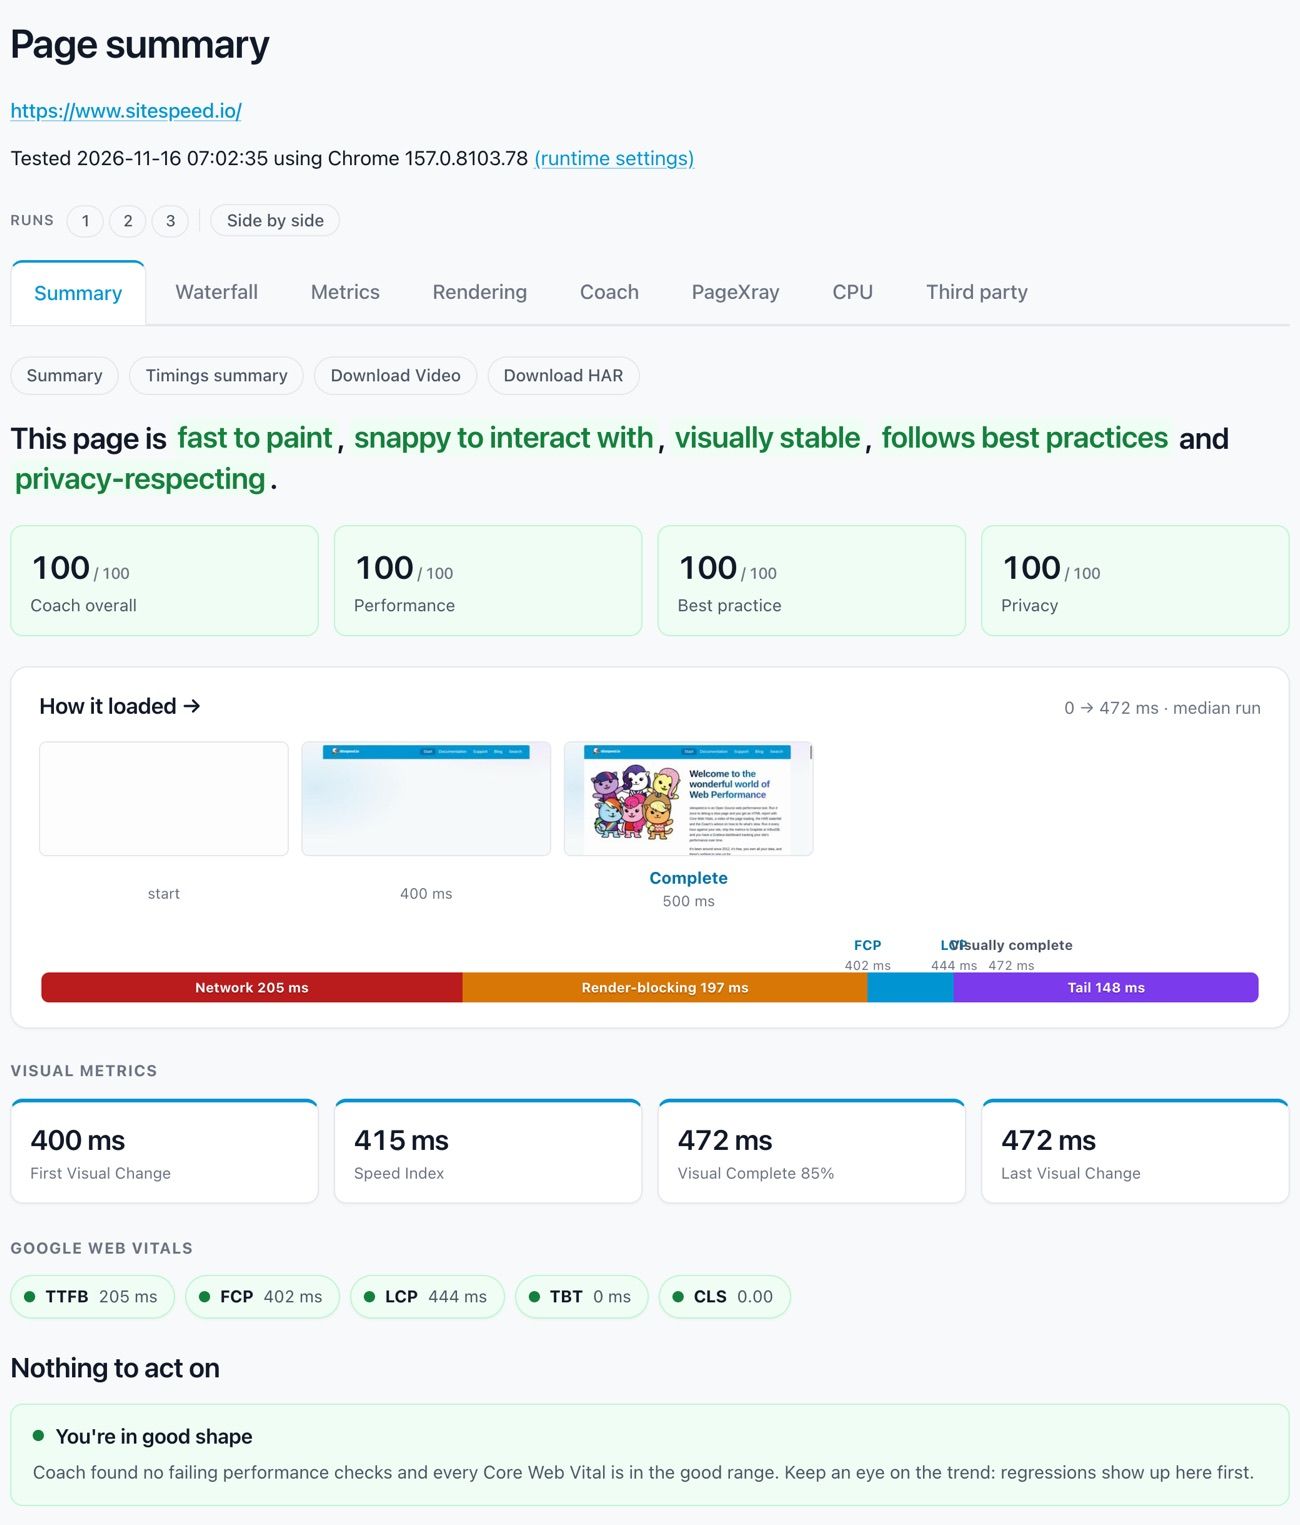
Read it from the top:
- The sentence sums up the page. Green words are strengths, yellow and red words are problems.
- The Coach scores tell you how well the page follows performance, best practice and privacy advice. Click a score to see the advice.
- How it loaded shows frames from the video of the median run, and a bar that splits the load time into phases: waiting for the server (Network), render-blocking requests, the time until the largest paint and the rest of the load (Tail). Click How it loaded to watch the video on the Rendering tab.
- Visual metrics and Google Web Vitals are the main timings of the median run.
- What to act on lists the most important problems that the Coach found, worst first. For www.sitespeed.io there is nothing to act on. Your own page will probably have something here, and that is where you start.
Step 4: Check if the runs agree
Scroll down to Timings summary. For each metric you get the fastest (min), median, mean and slowest (max) value of the three runs.
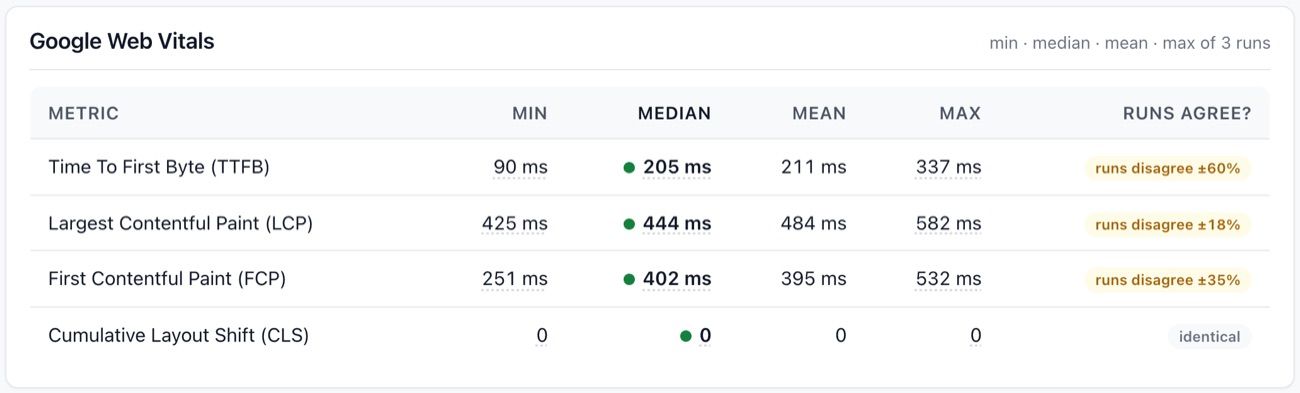
Look at the Runs agree? column. In this test, the time to first byte was 90 ms in the fastest run and 337 ms in the slowest. The network and the server do not answer equally fast every time, so one run is not enough to trust a number. sitespeed.io uses the median, because one slow run does not move it.
When the column says runs disagree, run the test more times. Five runs is a good start:
docker run --rm -v "$(pwd):/sitespeed.io" sitespeedio/sitespeed.io:43.0.0 https://www.sitespeed.io/ -n 5The numbers 1, 2 and 3 next to Runs at the top of the page open the report for each run, and Side by side shows all metrics for all runs in one table.
Step 5: See what the page loaded
Click the Waterfall tab. The waterfall shows every request the browser made, when it started and how long it took. A long bar or a long chain of requests before the first paint is often the reason a page is slow. Read Understand the waterfall to learn what the colors and lines mean.
The other tabs go deeper:
- Metrics has all the timings of the page.
- Rendering has the video, the filmstrip and why the first paint was delayed.
- Coach has all the advice, with how to fix each problem.
- PageXray shows what the page is made of: requests, sizes and content types.
- CPU shows what the browser main thread did.
- Third party shows the requests to other domains.
Step 6: Test your own page
Now test your own page. Change the URL, run five times and test it as a mobile phone:
docker run --rm -v "$(pwd):/sitespeed.io" sitespeedio/sitespeed.io:43.0.0 https://www.example.org/ -n 5 --mobileReplace https://www.example.org/ with the URL of your page. --mobile makes Chrome act as a mobile phone (screen size and user agent).
Open the new report and start with What to act on on the Summary tab.
Summary
You have:
- Run a test with Docker and found the report.
- Read the start page and the page summary.
- Learned that the report shows the median of several runs, and how to see if the runs agree.
- Tested your own page.
Learn more
- Good options to get started: the options that most users need.
- Understand the waterfall.
- Web performance testing in practice: how to get stable test results.
- Connectivity: test with a slower network.
- Scripting: test a user journey, for example a login.