Documentation / Waterfall
Waterfall
The waterfall shows every request the browser made to load the page, in the order the browser started them, on a shared time axis. Use it to see what the page waited for: a slow server, a long chain of requests, or a file that blocked the first paint.
You find the waterfall on the Waterfall tab of each page. On the page summary it shows the median run (the line above the waterfall tells you which run), and on each run page it shows that run. The waterfall is drawn from the HAR file, so it needs a browser that gives us a HAR (Chrome, Edge, Firefox and Safari on iOS).
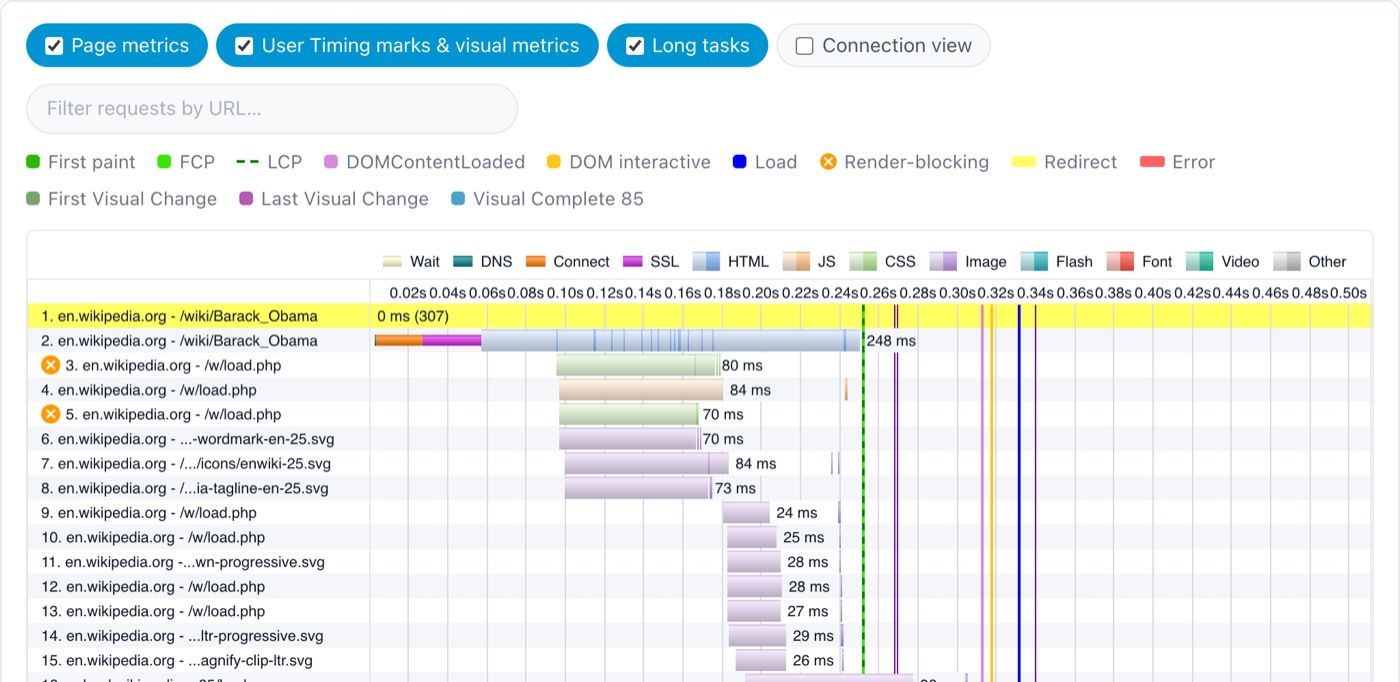
One row is one request
Each row starts with the request number, the domain and the path. The text after the bar is the total time of the request. If the response is not a 2xx response, the status code follows in parentheses, for example 0 ms (307). A request that never finished shows (request canceled).
- An orange circle with a cross in front of the number marks a render-blocking request. Chrome reports that the browser must load this file before it can paint anything. Only Chrome and Edge give us this information.
- A blue URL means that the request belongs to another document than the page, for example an iframe.
- A yellow row is a redirect (3xx). A
304 Not Modifiedis not marked, because it is a cache check and not a redirect. - A red row is an error: a 4xx or 5xx response, or a request that failed.
The colors of the bar
The legend on top of the waterfall shows all the colors.
The thin part at the start of a bar is the time before the browser could send the request:
- Wait (pale yellow): the request was queued in the browser.
- DNS (dark teal): the browser looked up the domain name.
- Connect (orange): the browser opened a TCP connection.
- SSL (purple): the browser set up TLS.
You only see DNS, Connect and SSL on a request that opens a new connection. Requests that reuse a connection start directly with the thick part.
The thick part of the bar has the color of the content type: blue for HTML, orange for JavaScript, green for CSS, purple for images, red for fonts, teal for video and gray for other content. Each bar uses two shades of its color:
- The light shade is the time from when the browser sent the request until the first byte came back. A long light part means a slow server or a slow network.
- The dark shade is when data arrived. With Chrome you often see the dark part as several thin slices: each slice is a part of the response that arrived at that time. A long gap between slices means the browser waited for more data.
The vertical lines
The vertical lines show what happened on the page while the requests loaded. Move the mouse over a line to see its name and time.
- Page metrics: First paint, First Contentful Paint (FCP), Largest Contentful Paint (LCP, the dashed line), DOMContentLoaded, DOM interactive and Load. The legend above the waterfall shows the color of each line.
- User Timing marks & visual metrics: the User Timing marks that the page sets, and First Visual Change, Visual Complete 85% and Last Visual Change if you test with
--video --visualMetrics. The User timings row under the waterfall lists them with their times.
A request that ends to the left of the FCP line finished before the first paint. If a render-blocking request ends just before the FCP line, the paint probably waited for it.
Long tasks
Under the requests, the Long Tasks lane starts at First Contentful Paint. Green means that the main thread could respond. A red block is a long task: the main thread was busy for 50 ms or more and the page could not respond to the user. Long tasks before First Contentful Paint are not in the lane. You find all long tasks on the CPU tab.
Controls
- Page metrics, User Timing marks & visual metrics and Long tasks show or hide the lines and the long tasks lane.
- Connection view shows one row for each network connection instead of one row for each request. Use it to see how many connections the page opened and how the requests shared them.
- Filter requests by URL shows only the requests that contain the text you type. The counter shows how many requests match.
- Zoom: press the mouse button in the waterfall and drag to the left or right to zoom in on that time. On a touch screen, pinch. Click Reset zoom to see all the requests again.
- Download HAR gives you the HAR file. You can open it in other tools, for example the Network panel in Chrome DevTools.
- Save image saves the waterfall as a PNG.
If you test with --html.showAllWaterfallSummary, the page summary has a selector to choose the HAR of another run.
Look at one request
Click a request to see all the information about it.
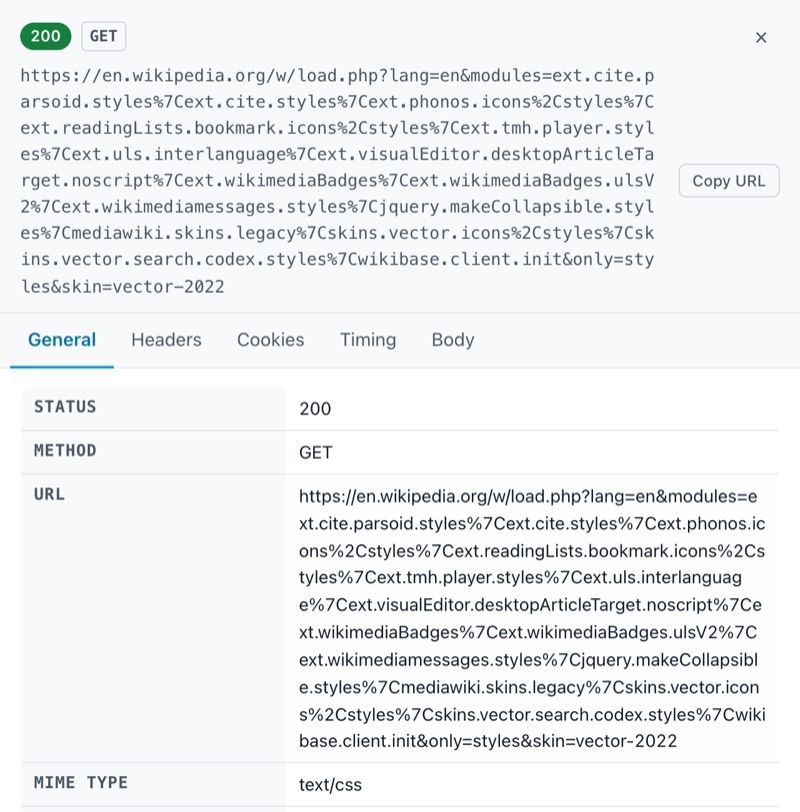
- General shows the status, the content type, the size, the HTTP protocol, the priority that the browser gave the request and what started the request.
- Headers shows the request and response headers.
- Cookies shows the cookies that the browser sent and the cookies that the server set.
- Timing shows how long each phase of the request took.
- Body shows the response. The HAR only has the response bodies if you test with
--browsertime.chrome.includeResponseBodies all(Chrome) or--browsertime.firefox.includeResponseBodies all(Firefox).
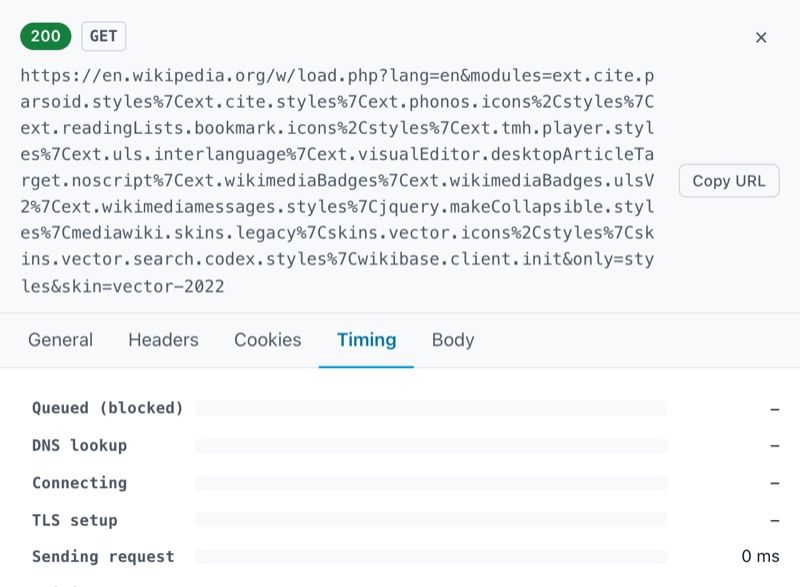
In this example the CSS file waited 68 ms for the first byte and downloaded in 13 ms: the time is in the server response, not in the download.