Documentation / Sustainable web plugin
Sustainable web plugin

We know using the internet means using electricity to power servers. And because most of that electricity comes from burning fossil fuels, it means every byte sent has a cost in carbon as well as power. The sustainable web plugin combines the latest in peer reviewed science and open data from the Green Web Foundation to help you build greener, more sustainable websites and applications!
We work out how much energy it takes to serve a site, then work out how much CO2 is emitted to generate the power needed for that electricity, based on what information we have about where the power comes from.
Chris Adams has written down more details on how we do the calculations.
How to use it
Enable the plugin by adding --sustainable.enable:
docker run --rm -v "$(pwd):/sitespeed.io" sitespeedio/sitespeed.io:42.1.1 https://www.sitespeed.io/ --sustainable.enableThe result
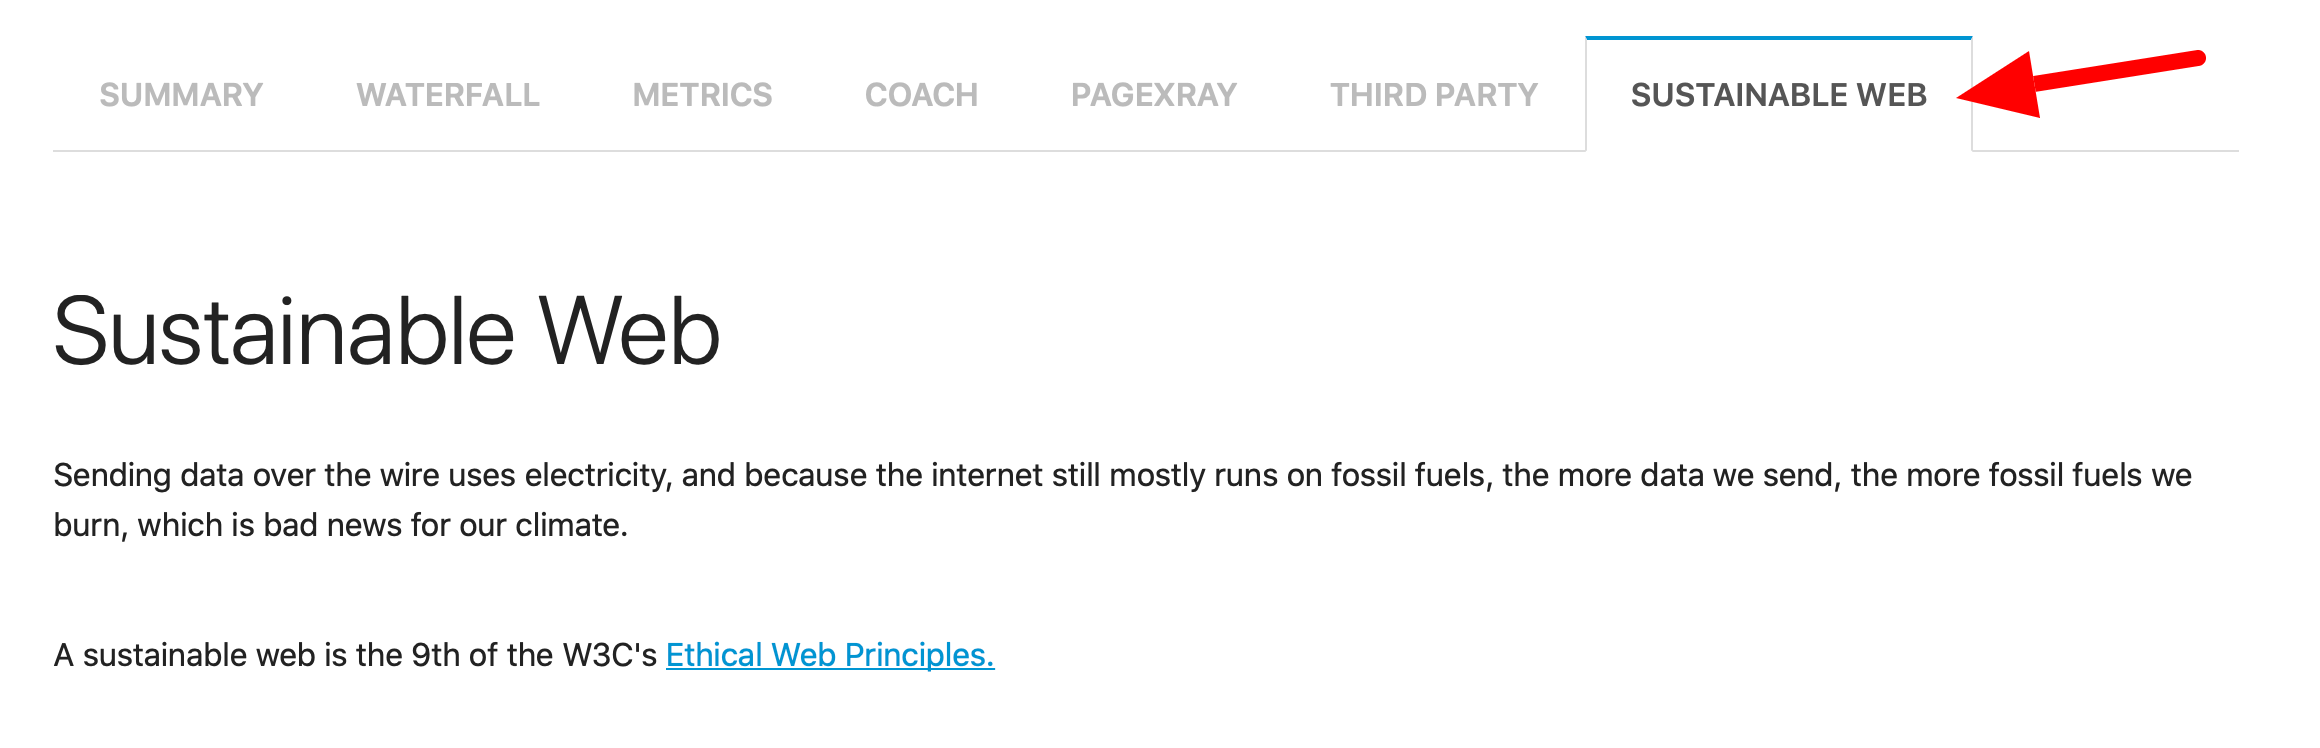
All data is produced under the new tab called Sustainable Web.
The plugin will use the transfer size of every asset and the domain (to know if the server runs on green energy) and estimate the total amount of carbon emission for one page view.
First you will see the amount of estimated carbon emission for one page view.
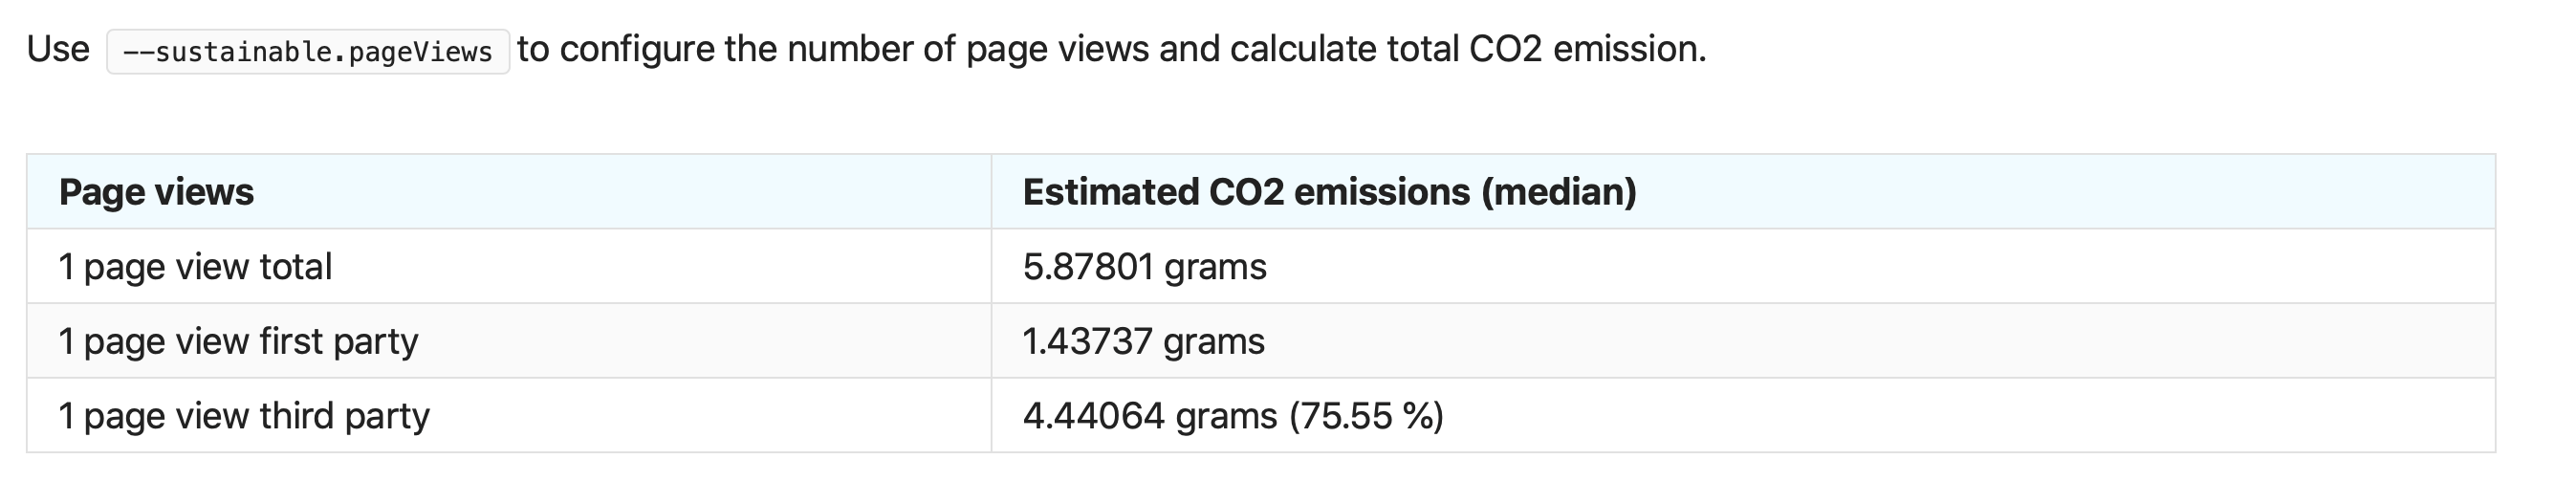
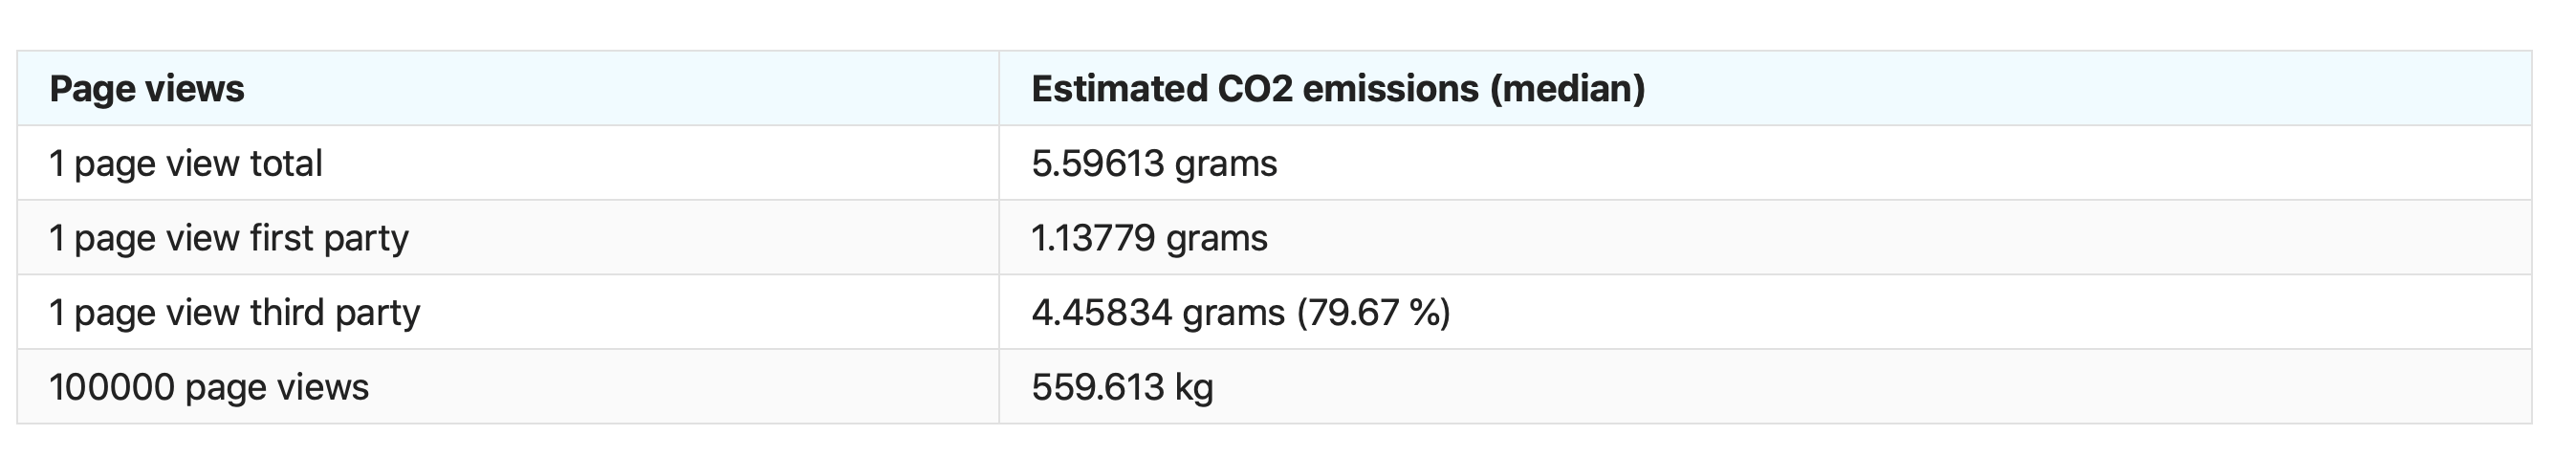
But you can also add --sustainable.pageViews to your run and you will get the estimated carbon for that number of page views. If you run it with --sustainable.pageViews 100000 you will get something like this:
Both the amount per page view and the total amount will be automatically sent to Graphite/InfluxDB.
We also categorise content per first/third party (with the --firstParty switch). You can see that for the site in this example, the estimated carbon emission from third parties is over 79% of the total emission :(
The next cut is per domain.
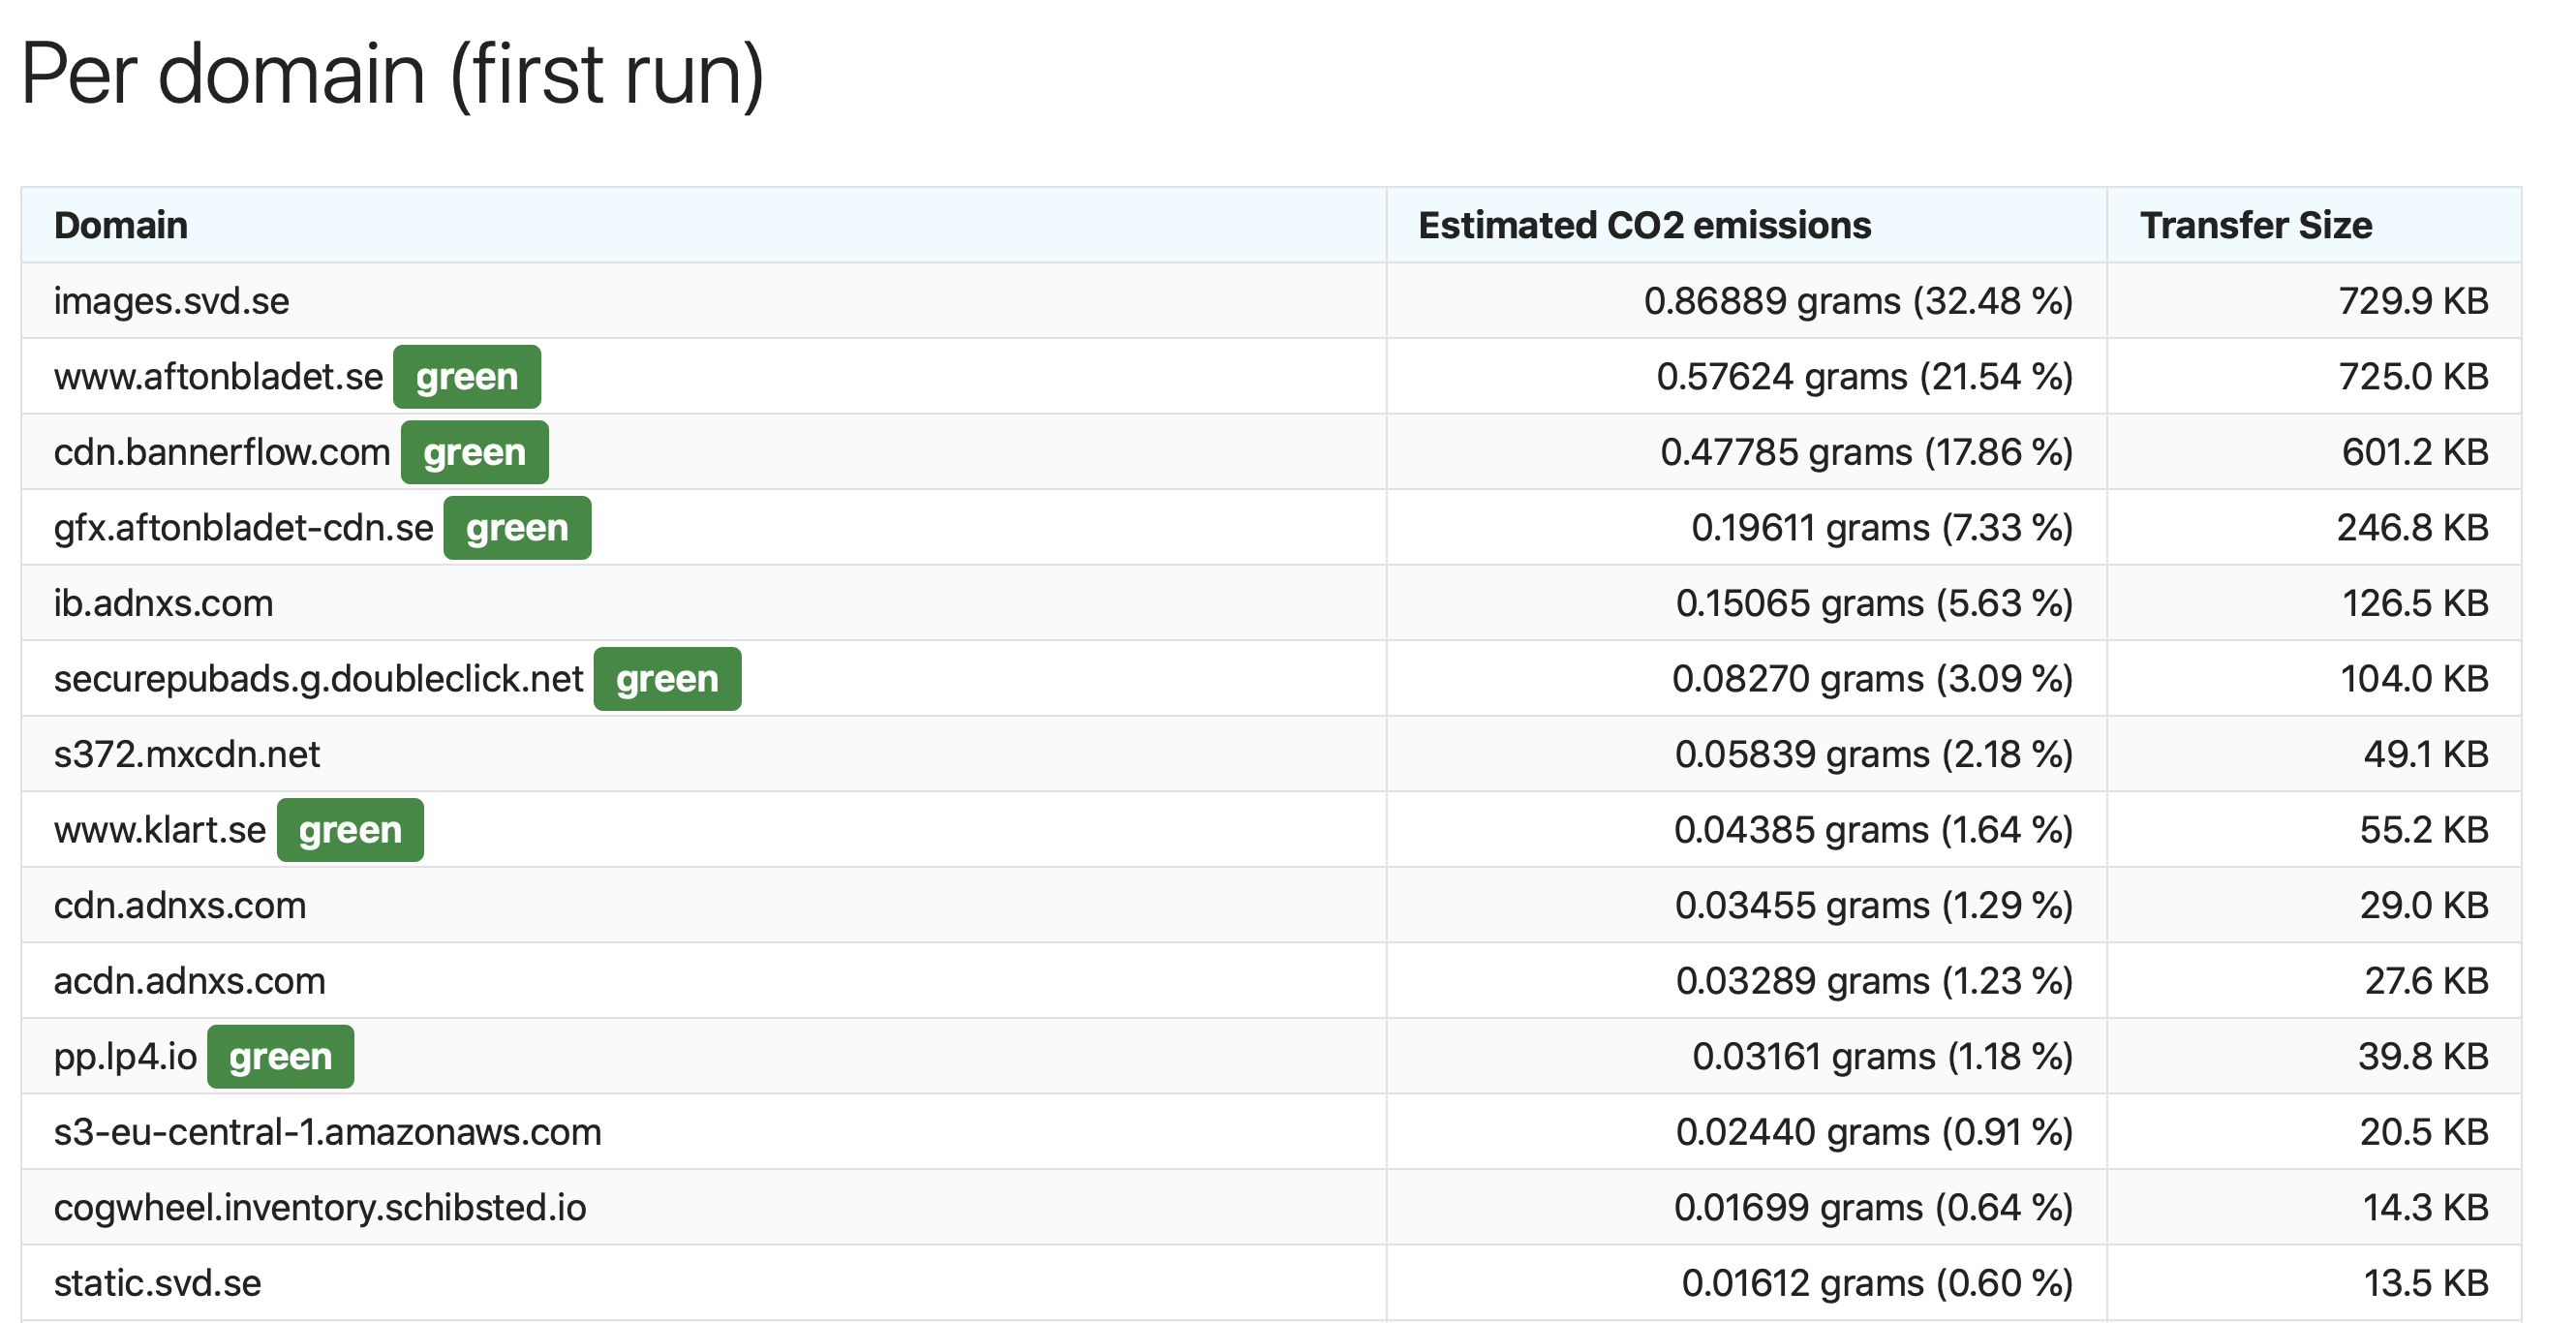
The green sign that says green means that the domain is marked as running on green energy in the Green Web Foundation database.
We also produce a list of the top ten dirtiest assets on the page, the ones that produce the most carbon emissions.
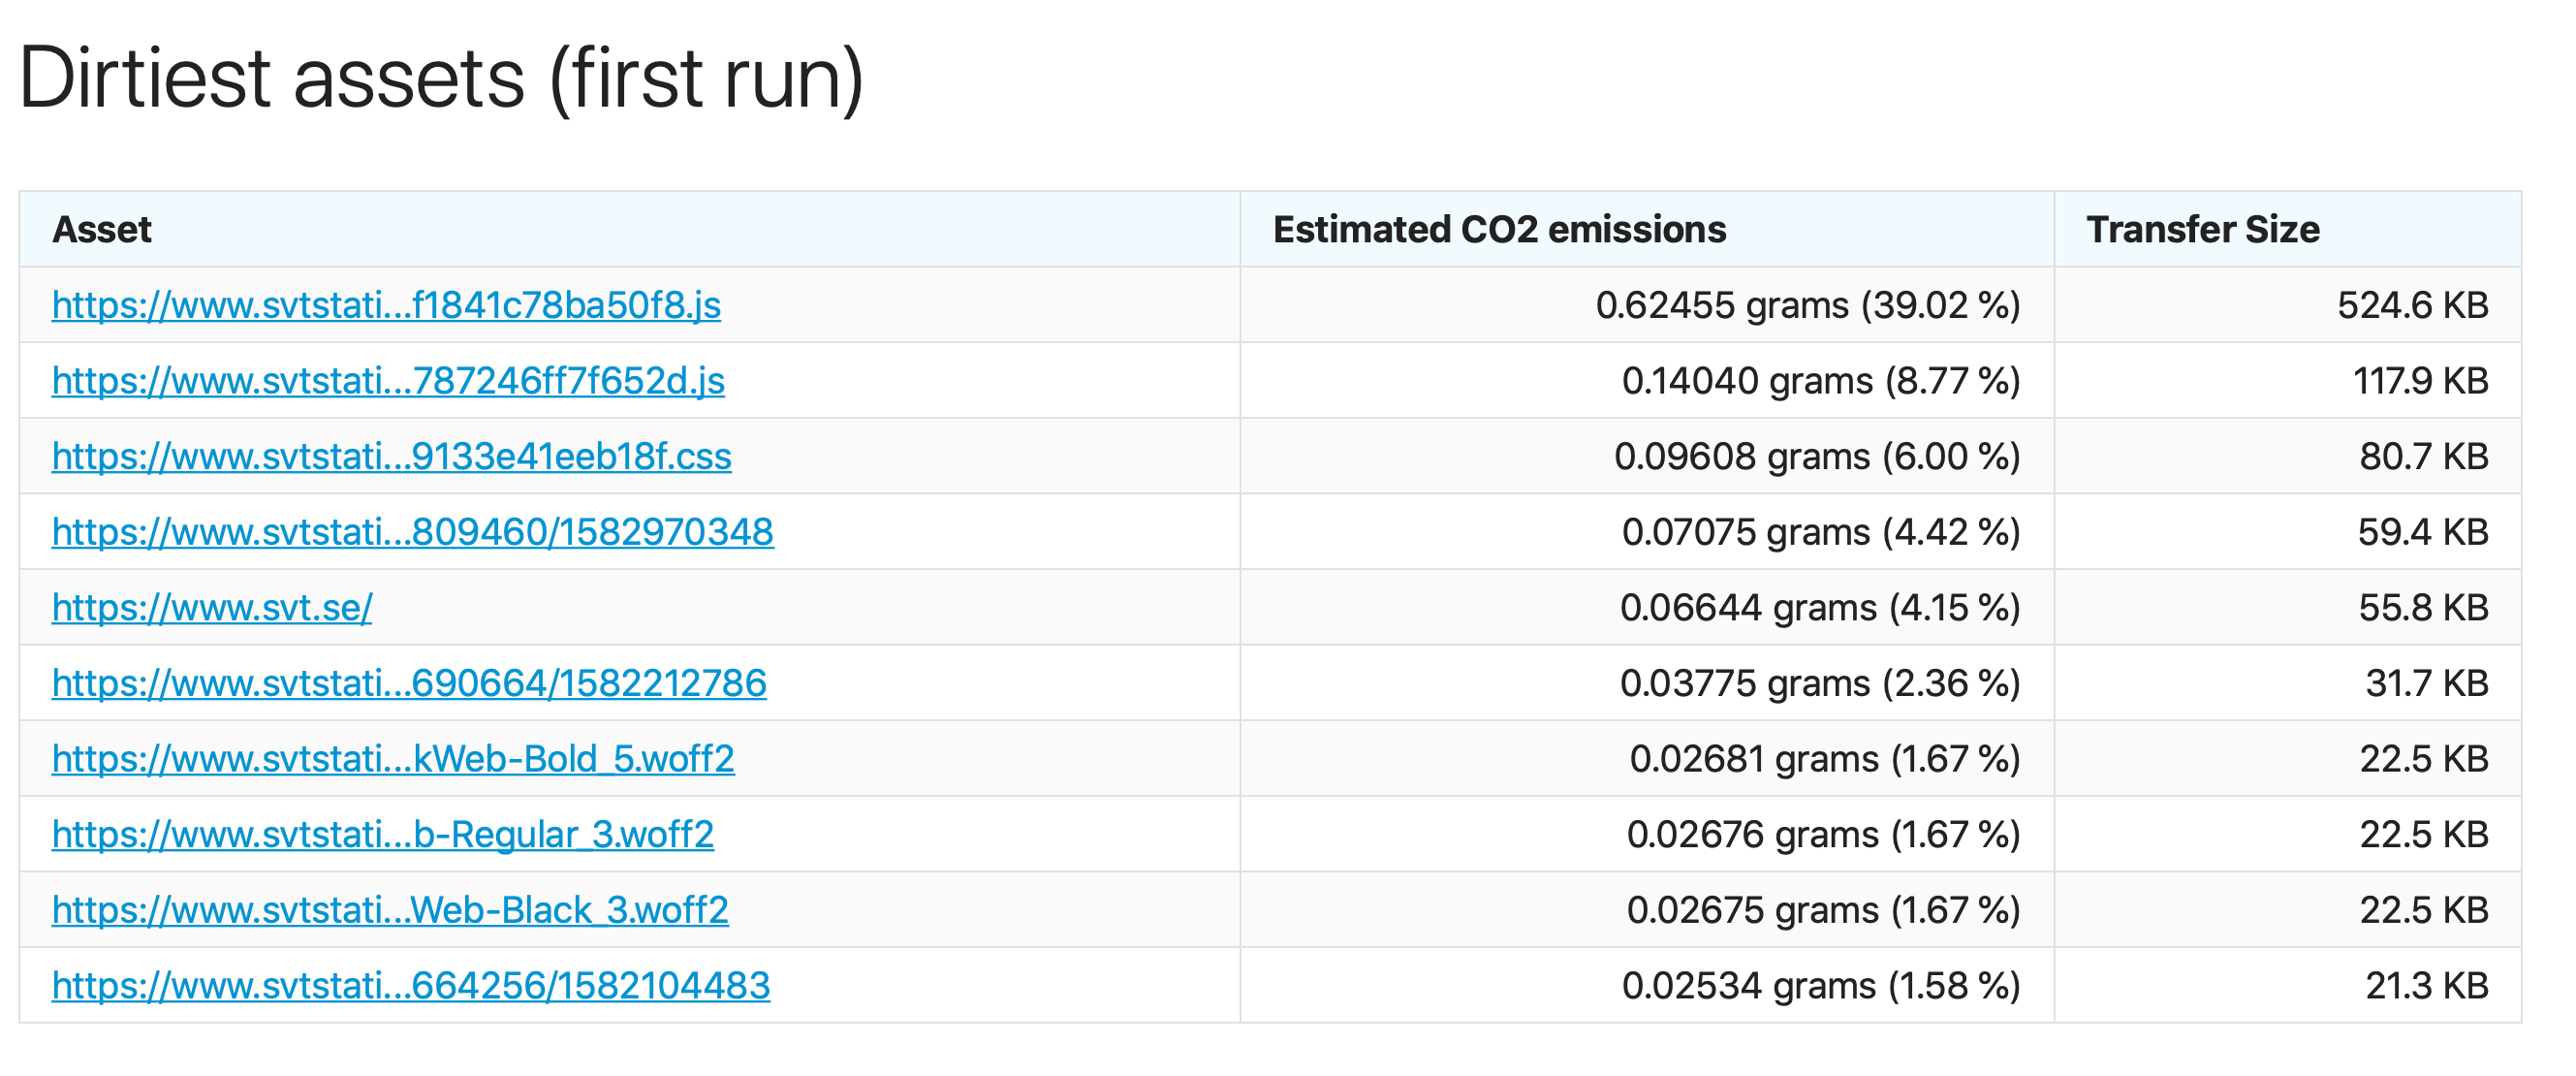
Here we have one JavaScript bundle that produces 39% of the total emission for that page. I wonder what kind of cool functionality they have on the page? :)
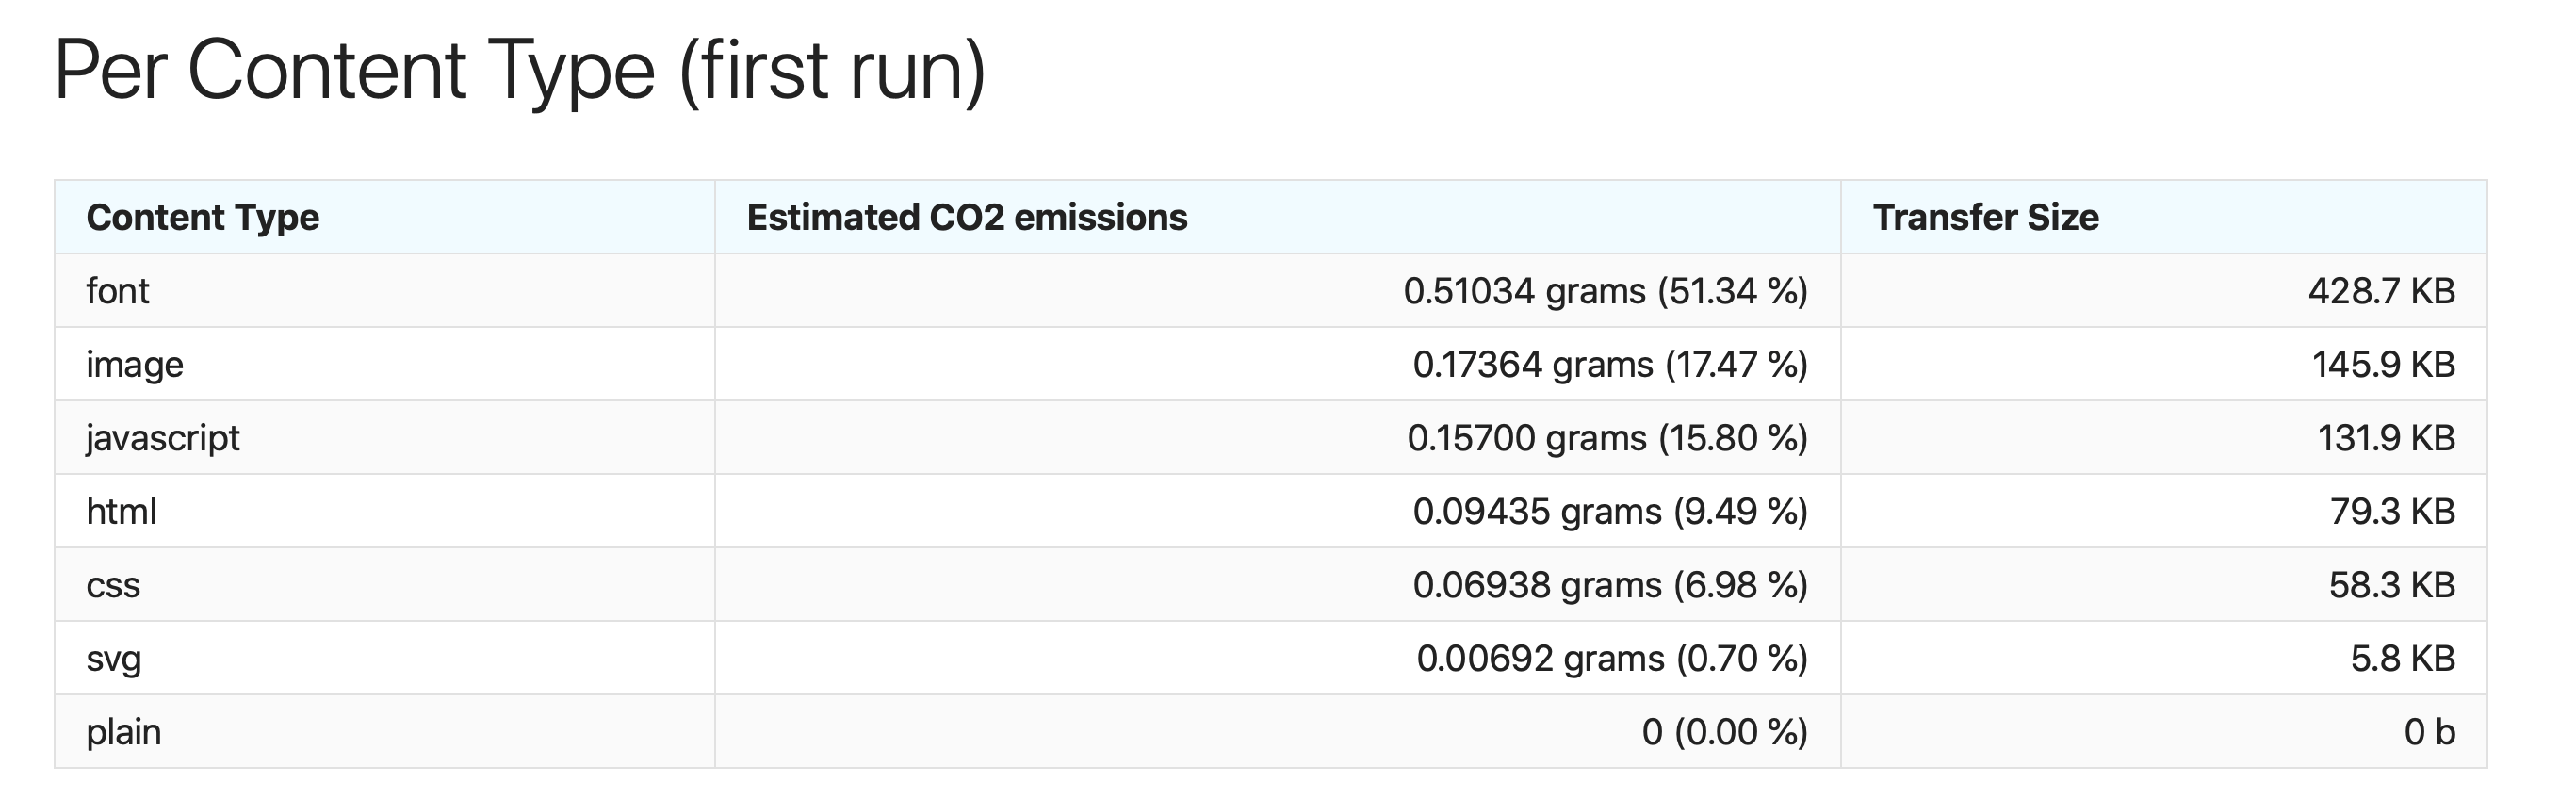
We also slice and dice the data per content type. This is interesting because it can help you make environmentally friendly decisions. For example, for this website, having a specific font accounts for over 50% of the estimated carbon emission for that page.
Extra configuration
By default the hosting data (knowing whether a host is green) is collected from a local SQLite database included in sitespeed.io. You can use the Green Foundation's API directly for the latest, fresh data using --sustainable.useGreenWebHostingAPI. That will generate a GET request to the API though.
You can also disable the hosting match (all hosts will be treated as grey hosting) with --sustainable.disableHosting.
How it works
Short version
We work out how much energy it takes to serve a site, then work out how much CO2 is emitted to generate the power needed for that electricity, based on what information we have about where the power comes from.
The slightly longer version
First, work out the energy needed
We work out how much energy it takes to serve a site, based on the 1byte model published by The Shift Project in their report Lean ICT: for a sober digital.
This in turn draws numbers from the paper Projecting the chiaroscuro of the electricity use of communication and computing from 2018 to 2030. This is the most recent peer-reviewed source we could find offering a breakdown of energy use by data centre, data transfer and device usage. When we find a more recent, up-to-date model offering a similar breakdown, we will update the plugin to use it.
While the 1byte model also includes the energy usage for the production and use of devices, we do not include this in our calculations. We do this for a number of reasons:
The first is that devices use power differently when viewing a website or application compared with continuously downloading video. This is acknowledged in The Shift Project's own report.
The second is that the sitespeed.io plugin is intended to help people realise that performance budgets can also be carbon budgets, and that they can take measurable steps to improve the climate impact of digital services through changes in how they are made.
Third, the majority of the carbon emissions from a device come from the actual production of a smartphone or laptop, not its use. While thoughtful design choices can make it possible to run applications and websites on older hardware, it's much more difficult to measure how these design changes affect the climate impact without collecting further information about the end user's devices. This is possible with analytics tools like Matomo, but it goes beyond the scope of this plugin.
Estimating carbon for this energy
Once we have the estimated energy usage needed to serve a site, we need to work out the emissions from that energy: one figure for conventional, 'grey' power, and one for renewable green power.
Larger data centres have historically been sited close to sources of cheap power available around the clock, which would usually have come from fossil fuels. This often results in an energy mix that tends to be dirtier than average, so we use The Shift Project's figure of 519 grams of CO2 per kilowatt hour.
For the rest of the internet, we use the International Energy Agency's figure of 475g of CO2 per kilowatt hour for 2018, as an average across the globe.
Where we know power is generated using renewables, we use the figure from the UK's regulator Ofgem, for renewables including solar, wind and hydroelectricity, of 33.4 grams of CO2 per kilowatt hour. To tell how a site is powered, we look up the domain with the Green Web Foundation, either via their API or, when available, using their publicly available url2green dataset.