Documentation / Video
Video
The stack (easy with Docker)
We use FFmpeg to record a video at 30 fps of the screen (you can configure the number of frames per second). The easiest way is to use our Docker container with pre-installed FFmpeg, but if you use the npm version, you can record a video too. Video works on Linux and OS X at the moment.
Once we have the video we use Visual Metrics (built by Pat Meenan) to analyse it and get SpeedIndex and other visual metrics. If you use our Docker container you get that for free, otherwise you need to install FFmpeg, ImageMagick and a few Python libraries (pyssim, opencv-python, numpy, scipy) — see the installation instructions for your OS.
We record the video in two steps. First we turn the background orange (this is used by VisualMetrics to know when the navigation starts), set the background to white, and let the browser go to the URL. The video is recorded lossless. Then, when the video has been analysed, we remove the orange frames and convert the video to a compressed mp4.
The video will look something like this: watch on YouTube.
Video related parameters
There are a couple of things that you can do to configure the video and the metrics.
SpeedIndex and other Visual Metrics
To collect Visual Metrics like firstVisualChange, SpeedIndex, visualComplete85%, visualComplete95% visualComplete99% and lastVisualChange you add the parameter --visualMetrics. The video will then be recorded, analysed and then removed.
Perceptual and Contentful Speed Index
When you run --visualMetrics you can also collect two alternative Speed Index calculations. Add --visualMetricsPerceptual for the Perceptual Speed Index, which compares frames using structural similarity (SSIM) instead of a plain histogram, and --visualMetricsContentful for the Contentful Speed Index, which weights the progress by the amount of visual content (edges) in each frame. Both are off by default and add a little extra analysis time.
Keep or remove the video
If you want to keep the video when you collect metrics or only want the video, just add --video to the list of parameters.
Save a video from only one run
Recording and keeping a video for every run costs time and disk. With --enableVideoRun sitespeed.io makes one extra run dedicated to the video, so you can collect Visual Metrics from all your normal runs but store only a single video. A typical setup is --visualMetrics true --video false --enableVideoRun true. If you combine it with --enableProfileRun the same extra run also collects the profiling trace.
Firefox window recorder
If you use Firefox you can use the built-in window recorder (instead of using FFmpeg) to record the video. The Mozilla team uses it to make sure recording the video doesn't add any overhead. Turn it on with --firefox.windowRecorder.
Video quality
You can change the number of frames per second (default is 30) by using --browsertime.videoParams.framerate. If you have a large server with a lot of extra CPU you can increase the rate. You should probably not decrease it below 30, since that will affect the precision of Visual Metrics.
You can also change the constant rate factor (see https://trac.ffmpeg.org/wiki/Encode/H.264#crf) to change the quality of the video. CRF is applied in the second step (we first record the video as lossless as possible).
Skip converting the video
When you record a video, the video is first recorded with settings to make the recording as fast as possible and with low overhead. Then the video is converted to a format that works better in most video players. If you want to speed up your tests, you may want to remove the video conversion, you can do that with --browsertime.videoParams.convert false.
Keep the original video
Before it is converted, the video is recorded in a raw, lossless format. If you hit a Visual Metrics bug and want to report it, add --browsertime.videoParams.keepOriginalVideo to keep that original video so you can attach it to a GitHub issue and we can reproduce what you saw. It is off by default.
Remove timer and metrics from the video
The video will by default include a timer and show when visual metrics happen. If you want the video without any text/timer, just add --browsertime.videoParams.addTimer false.
Filmstrip parameters
When the video is analysed with VisualMetrics screenshots for a filmstrip are also created, and shown on the Rendering tab in the HTML report (on the page summary and on each per-iteration page) together with the video: clicking a frame seeks the video to that moment, and if you test without --video the filmstrip drives a large frame preview instead.
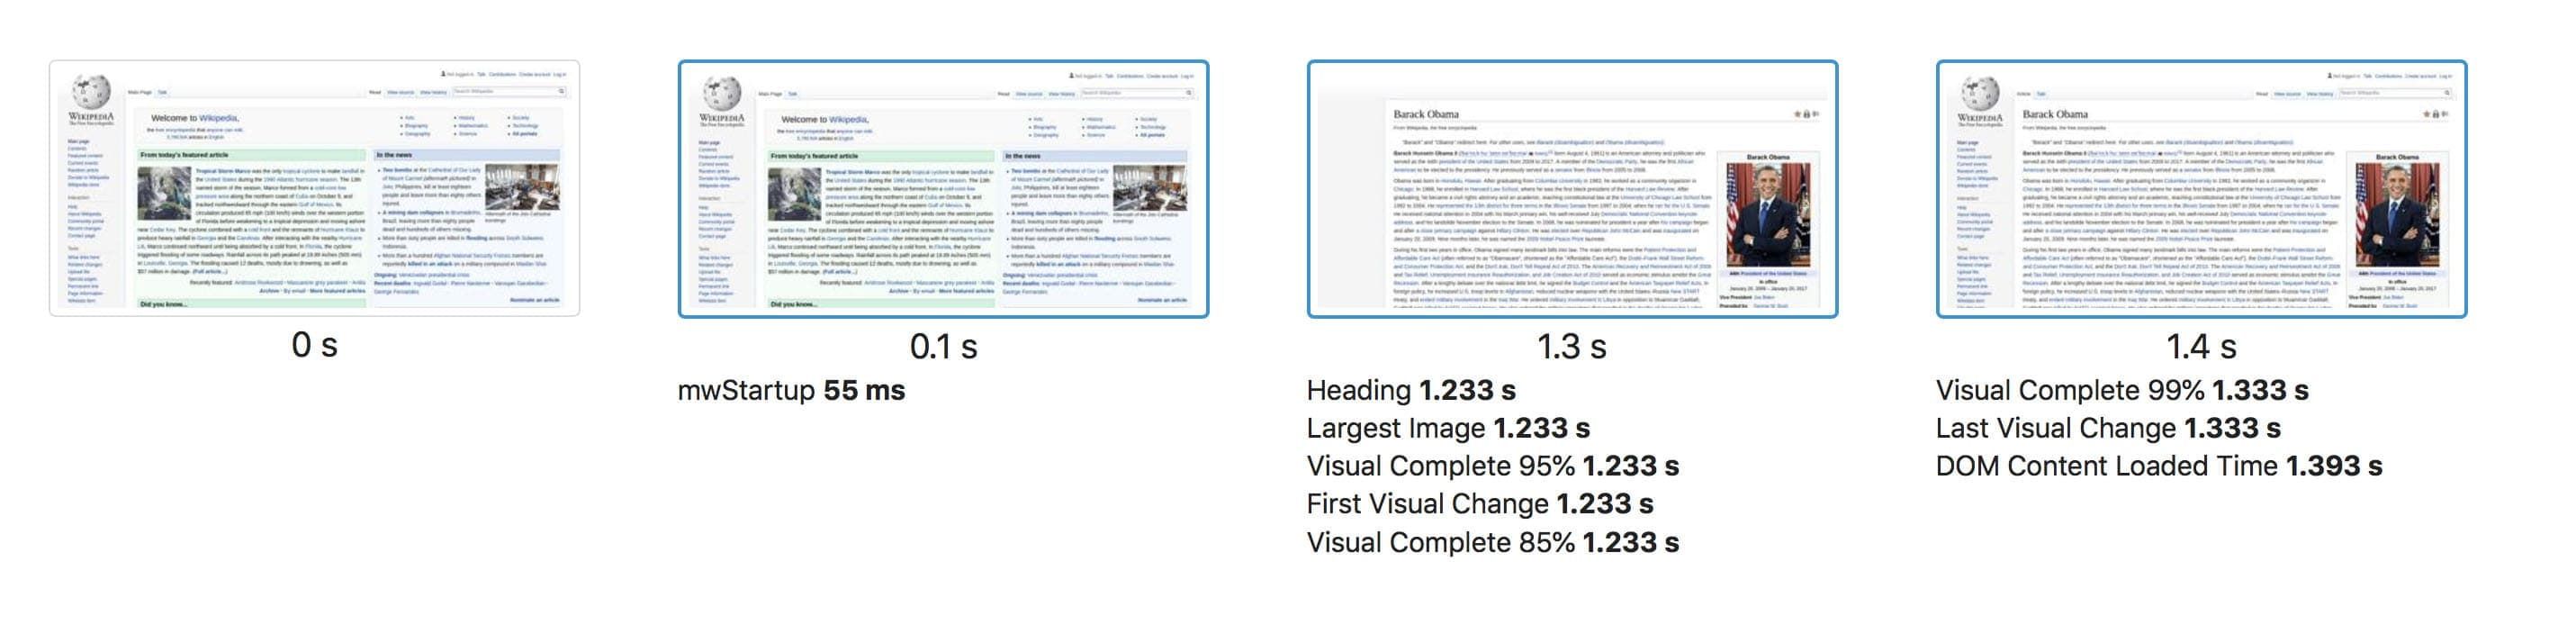
By default we only show screenshots that differ or have a metric collected at the same time. If you want to see all the screenshots, you can do that with --filmstrip.showAll.
If you don't use those images you can turn them off with --videoParams.createFilmstrip false.
If you use them and want them the same size as the video (they are max 400 pixels in either direction by default), you can turn on full size with --videoParams.filmstripFullSize.
To change that maximum without going full size, set --videoParams.thumbsize to the number of pixels you want (the default is 400). --videoParams.filmstripFullSize overrides it.
If you want to change the quality (compression level 0-100) of the images, you do that with --videoParams.filmstripQuality.
Frame diffs and the visual instability heatmap
With --browsertime.videoParams.filmstripDiff (browsertime 28.2+) every filmstrip frame also gets a precomputed diff image: the frame dimmed with every pixel that changed since the previous frame painted red. The Rendering tab's filmstrip lightbox shows it behind a Diff toggle together with exact changed-pixel counts, which makes it easy to see what a visual change actually was, including changes too small to spot by eye. The diffs are computed during the run, so they work when the report is opened straight from disk (without the flag the lightbox computes the diff in the browser, which needs the report served over http(s) for exact counts).
The same flag produces one visual instability heatmap per run: every pixel tinted by how often it changed during the whole recording, from amber (changed once) to deep red (changed ten or more times). A page that paints once and stays put is flat amber; red speckle in the shape of the text means the same pixels repainted over and over, usually invisible rendering noise that inflates Last Visual Change and Speed Index; a solid red block is a genuinely restless area like an ad or a carousel. The color scale is fixed so heatmaps from different runs are directly comparable. The heatmap and its summary numbers show up on the Rendering tab below the filmstrip.
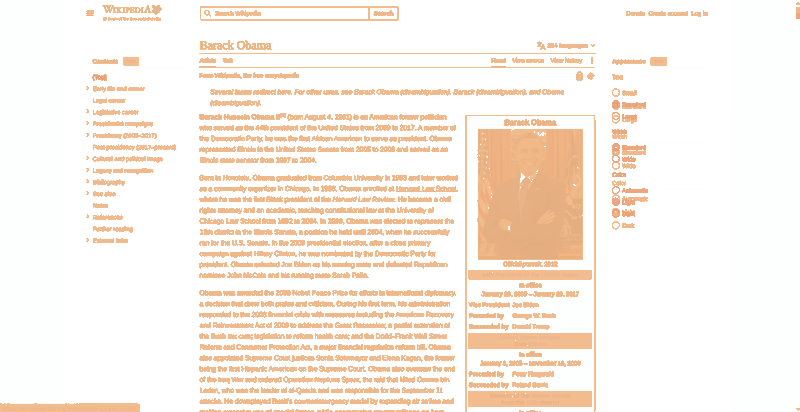
The heatmap above is a Wikipedia article: almost everything is flat amber, so each pixel changed only once as the page painted and then stayed put. Speckled or solid red would mark the areas that kept repainting.
The flag is off by default since it stores one extra image per filmstrip frame per run.
Reduce invisible rendering noise
Browsers sometimes re-rasterize a page long after it looks done, leaving invisible sub-pixel noise on glyph edges. Visual Metrics counts that as change, which pushes out Last Visual Change, Speed Index and VisualComplete95/99 even though nothing visible happened (the instability heatmap above shows it as red speckle in the shape of the text). --browsertime.videoParams.noiseTolerance sets the percentage (0-100) of pixels allowed to differ between frames before a frame still counts as unchanged. The default is 0, which keeps the previous behaviour of allowing up to 5 pixels. If you see a Last Visual Change that lands too late with no visible change in the filmstrip, try --videoParams.noiseTolerance 0.05.
XVFB
If you run the Docker container we will automatically set up XVFB as a virtual frame buffer. If you run without Docker but still want to use XVFB, add --xvfb and sitespeed.io will start XVFB automatically. You only need to make sure it is installed.
Collect visual elements metrics
You can choose to collect when visual elements are visible (and at their final position) on the screen. Turn it on with --visualElements to collect Visual Metrics from elements. Works only with --visualMetrics turned on (default in Docker). By default you will get visual metrics from the largest image within the viewport and the largest H1.
If you want to add your own element, the easiest way is to follow the Element Timing API: annotate your element with the elementtiming annotation. This will work even if your browser does not support the Element Timing API!
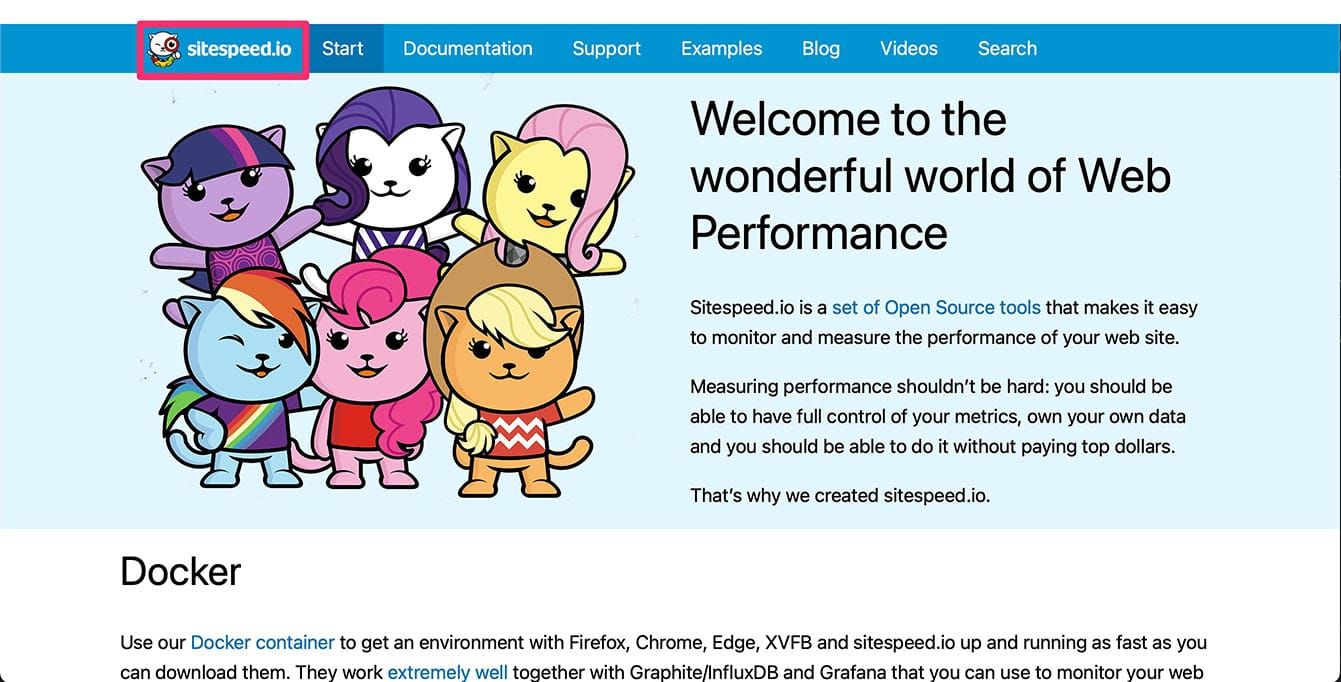
Say that we want to know when the sitespeed.io logo appears on the screen. Then we add the annotation and give that image a unique name (so we know what we are measuring). It will look like this:
<img src="/img/team.png" alt="sitespeed.io Logo with My Little Pony style cats" elementtiming="logo">If you cannot edit the HTML of the site, you can still measure when elements are painted on the screen, but it's a little more work. You can configure picking up your own defined elements with --scriptInput.visualElements. Give the element a name and select it with document.body.querySelector. Use it like this: --scriptInput.visualElements name:domSelector. Add multiple instances to measure multiple elements.
Visual Metrics will use these elements and calculate when they are visible and fully rendered. These metrics will also be included in the HAR file, so you can look at the waterfall and see when elements are visible within the viewport.
Let's say that we want to measure when the logo of sitespeed.io is painted on screen and we cannot add the annotation.
Open up DevTools/web inspector and select the image:
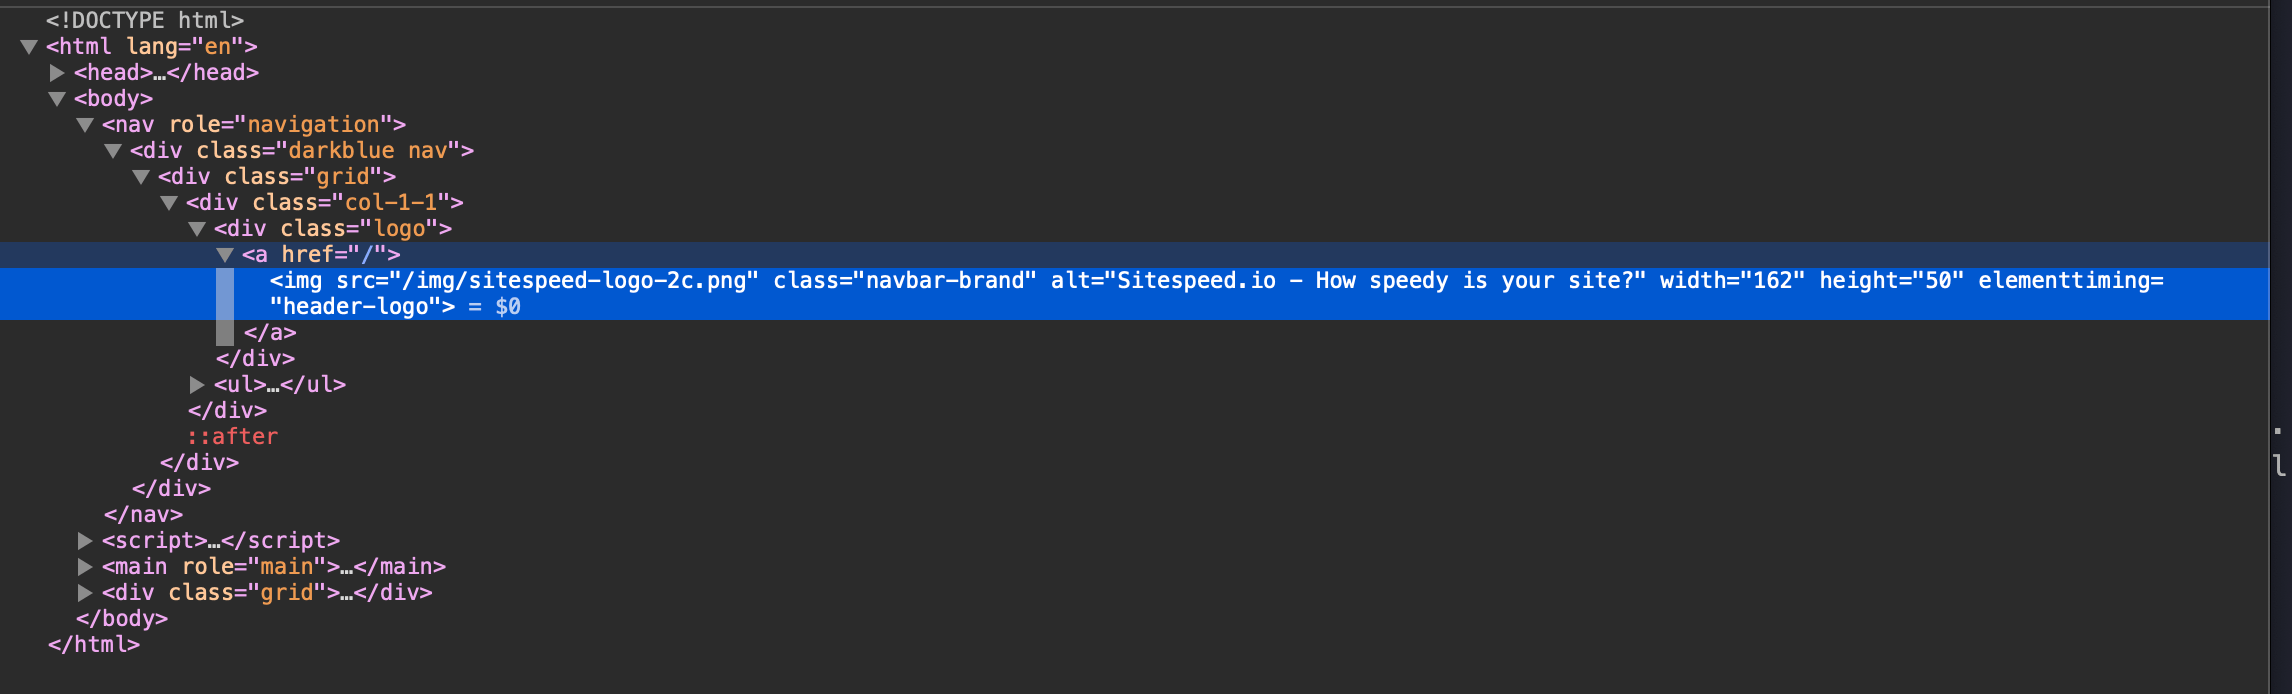
The next step is to find that element using document.body.querySelector. Do that in your web console. The logo has a unique class, so let's use that: document.body.querySelector(".navbar-brand").
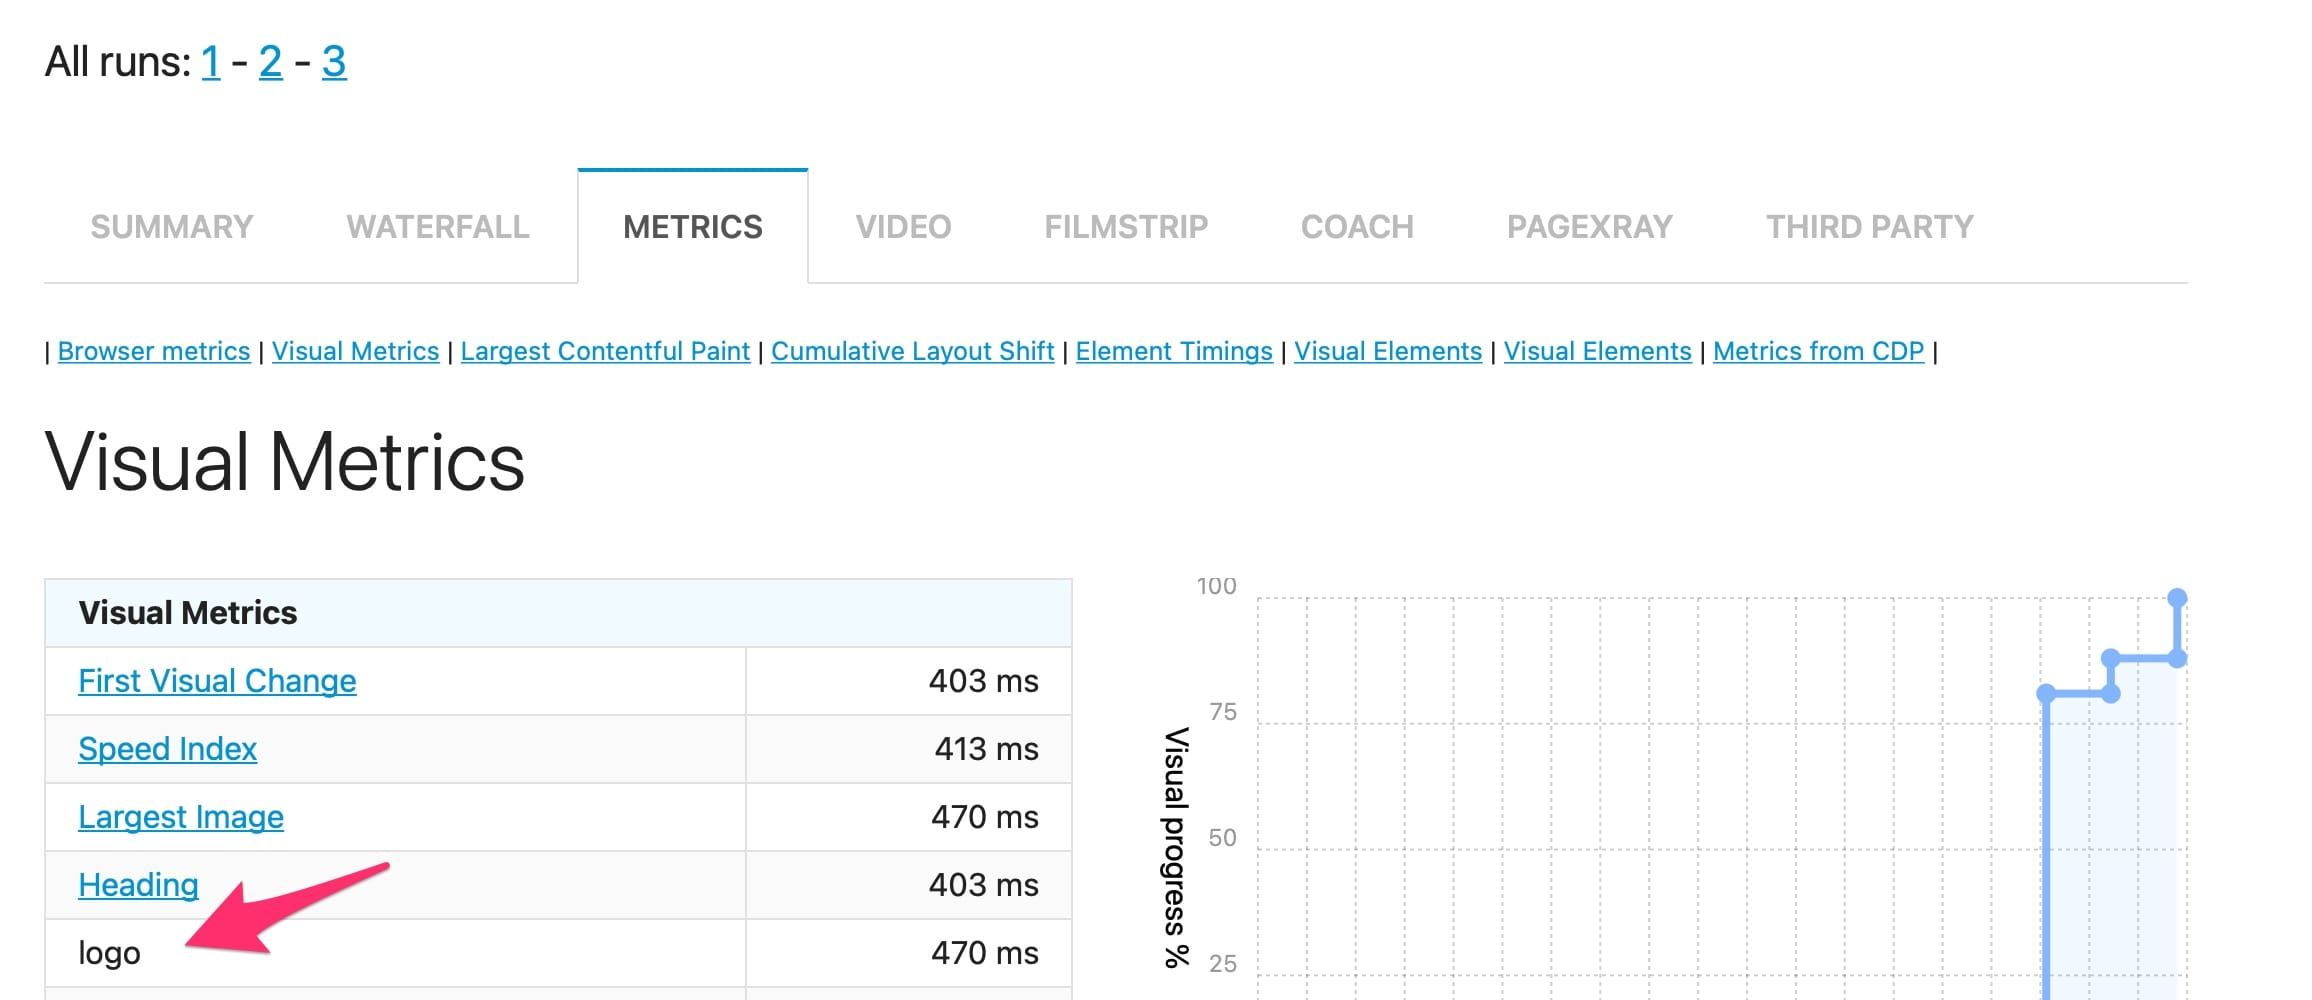
Then try it out in sitespeed.io. Let's name the element ... logo :)
docker run --rm -v "$(pwd):/sitespeed.io" sitespeedio/sitespeed.io:42.7.0 -b chrome https://www.sitespeed.io/ --scriptInput.visualElements "logo:.navbar-brand" --visualElementsAnd you can see the result in the Visual Metrics section:
Compare two video runs (combine two videos)
One of the things we love about WebPageTest is the video where you can compare two different runs. Since sitespeed.io is serverless, it isn't something you can do on the fly. Instead we created a simple tool you can use. The only thing you need is Docker!
curl -O https://raw.githubusercontent.com/sitespeedio/sitespeed.io/main/tools/combineVideos.shchmod +x combineVideos.sh- Download the videos you want to compare, let's call them file1.mp4 and file2.mp4.
./combineVideos.sh file1.mp4 file2.mp4- You are done!
You will then have the two videos side by side, slightly slowed down to make it easier to compare them: watch on YouTube.