Documentation / Compare
Compare - Statistical Methods for Regression Analysis
Sitespeed.io utilizes Mann Whitney U and Wilcoxon tests for detecting performance regressions.
Why Mann Whitney U and Wilcoxon for Web Performance?
- Non-Parametric Nature: Both tests are non-parametric, making them ideal for web performance data, which often doesn't follow a normal distribution. This means they can reliably analyze data with outliers or skewed distributions, common in web performance metrics.
- Sensitive to Subtle Changes: The Mann Whitney U test, used for comparing two independent samples, and the Wilcoxon test, suitable for paired data, are sensitive to even minor shifts in performance. This sensitivity is critical for early detection of regressions that might not significantly impact average values but could affect user experience.
- Robust Against Variability: Web performance metrics can be highly variable due to factors like network conditions, user behavior, and server load. These tests effectively handle this variability, providing a more accurate reflection of the true performance impact of changes.
- Clarity in Comparative Analysis: Unlike simple average-based comparisons, these tests give a clearer picture of whether the observed performance differences are statistically significant. This clarity is essential for making informed decisions about optimizations and rollbacks.
- Actionable Insights: By identifying statistically significant performance regressions, these tests provide actionable insights. They help in pinpointing specific changes that need attention, enabling targeted optimizations.
Utilizing these tests through the compare plugin allows for a sophisticated approach to web performance analysis. For instance, after deploying a new feature or update, you can compare the new performance data against a baseline using these tests. If the tests indicate a significant performance drop, it's a strong signal that the recent changes have negatively impacted the site's speed.
Looking at medians can make it hard to see small changes. This is an example where we look at first visual change for the Barack Obama page. You can see that the metric goes up at one point but then sometimes it comes back. 
Looking for a significant change helps. This is the graph for the same metric when the change occurred. 
Prerequisites
To get the compare plugin to work, you need to have Python installed and the scipy library in Python. The easiest way to install that is with pip: python -m pip install scipy. If you use our Docker containers this is already installed.
Save the baseline (save the world)
By default, tests run against a baseline test and look for regressions in the new test. That means that for your test to work you need to collect a baseline. You do that by adding --compare.saveBaseline to your test. You also need to give your test a unique id, which you do by adding --compare.id myId. Adding those to your test will store the baseline on disk. By default that file is stored in your current directory. You can change that by adding --compare.baselinePath to set the path. That is useful in Docker if you want the file to be stored outside the container.
To save a baseline using NodeJS:
sitespeed.io https://www.sitespeed.io -n 21 --compare.saveBaseline --compare.id start_pageUsing Docker, there's a new volume that you should mount where you want to save the baseline. -v "$(pwd)":/baseline will map your current directory to where you will store the baseline files. If you want to store them somewhere else, change what you map inside the container: -v "/somewhere/else:/baseline".
docker run -v "$(pwd)":/baseline sitespeedio/sitespeed.io:42.7.0 https://www.sitespeed.io/ -n 21 --compare.saveBaseline --compare.id start_page --compare.baselinePath /baselineThe baseline file is a JSON file that contains all the raw data from Browsertime.
Run your test
For your test to work, assign the same identification (id) to both your current test and the baseline test. This matching id is crucial for the test to correctly locate and compare with the baseline. Additionally, ensure that the number of iterations in your test matches that of the baseline. Remember, using a sufficiently large number of iterations is essential as it leads to more accurate and reliable results.
sitespeed.io https://www.sitespeed.io -n 21 --compare.id start_pageIn Docker:
docker run -v "$(pwd)":/baseline sitespeedio/sitespeed.io:42.7.0 https://www.sitespeed.io/ -n 21 --compare.id start_page --compare.baselinePath /baselineYou can also save a baseline for each and every test, so you always compare your last run with the run before. That will happen automatically if you have --compare.saveBaseline.
docker run -v "$(pwd)":/baseline sitespeedio/sitespeed.io:42.7.0 https://www.sitespeed.io/ -n 21 --compare.id start_page --compare.baselinePath /baseline --compare.saveBaselineResults
When you run your test it will create a new tab in the HTML results. The tab opens with the test setup on one line, a verdict ("2 of 24 metrics are significantly slower compared to the baseline") with chips that jump to the flagged metrics, and then one row per compared metric, grouped by area (timings, visual metrics, Google Web Vitals, CPU and so on).
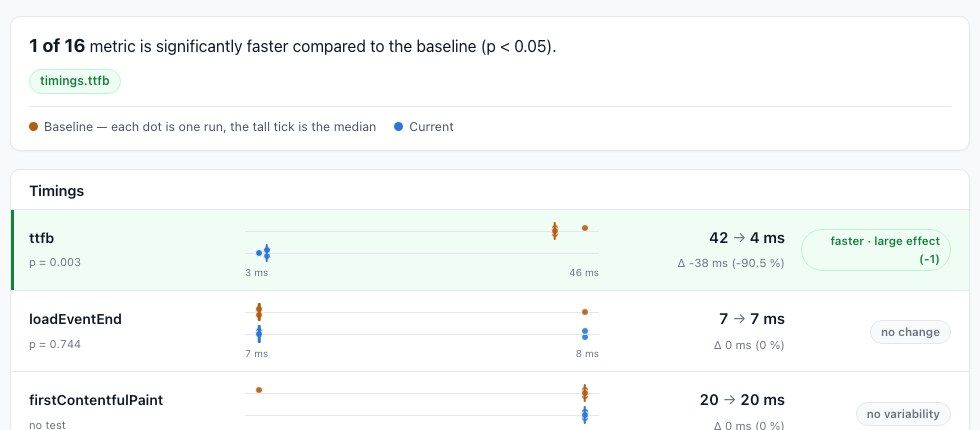
Each row shows:
- Metric name and p-value: the metric that was tested and the score from the Mann-Whitney U/Wilcoxon test. A score below 0.05 means the difference is statistically significant. Every metric keeps its own row; when a metric happens to carry exactly the same measured values as an earlier one in the group (the before-FCP and before-LCP pairs do whenever FCP and LCP are the same paint), it is tagged same values as X so the matching numbers don't read as a rendering mistake.
- The distribution strip: every baseline run (orange) and every current run (blue) as dots on a shared value axis, with a taller tick marking each median. Baseline and current are independent samples, so the strip shows the two distributions directly: a real shift is visible as the two clusters separating. When many runs land on the same value they render as one dot carrying a count, so twenty runs at 303 ms no longer look like a single run. Hover a dot for the exact run value.
- Median → median: the baseline and current medians with the difference in absolute numbers and percent. When the medians show the same value but the runs differ (flaky CPU long tasks do this), the means are shown instead. Under it the estimated shift with a 95% confidence interval, for example "shift +7 (+4 to +9 ms)": the Hodges-Lehmann estimate, the median of all pairwise baseline versus current differences. The p-value tells you how consistent a change is, the shift interval tells you how big it is and how sure we are. A change is real and meaningful when the whole interval sits away from zero; an interval straddling zero is noise no matter what a single delta number suggests.
- The verdict: whether the change is statistically significant, with the effect size (Cliff's Delta: negligible, small, medium or large) on its own line under the chip. Significant rows are tinted by direction, regressions in red and improvements in green. A row that tests significant while both medians show the same value (a CLS that moves from 0 to 0.0005 in a few more runs, say) is marked amber instead: statistically detectable but too small to matter, and the headline verdict counts it separately. With a one-sided test an improvement can never be significant, so a large effect in the untested direction is called out as "likely faster". Metrics that count things instead of measuring time (render-blocking elements, long tasks, layout shift) read higher or lower instead of slower or faster. Every row is also checked with a two-sample Kolmogorov-Smirnov test, which compares the whole distributions: when the rank test sees no change but K-S does, the row is marked amber and the wording follows the data. "Spread changed" means the median held while the runs spread differently, "less steady" means the median moved but the runs also vary more and "runs changed" covers the rest, often an intermittent slow path. At 20-ish iterations it catches clear variance growth and bimodality, not subtle shape drift.
The screenshots and video of the baseline and current runs live in the collapsed Run setup section above the verdict.
You don't need a statistics background to read the tab: the setup strip carries a collapsed about the statistics fold naming the algorithms (the rank test, Hodges-Lehmann, Cliff's delta and Kolmogorov-Smirnov) and what each contributes, the verdict card carries a collapsed How to read the numbers primer explaining p, shift, effect and the spread verdicts in plain language, and the p-value and effect lines on every row explain themselves on hover.
Understanding Significant Changes
Every metric row carries its score (the p-value).
If a score is below 0.05 it indicates a statistically significant difference between the baseline and the current data. By default we test if the current data is greater than the baseline. You can change that using --compare.alternative. You can test if it's smaller or if there is any difference between the two ('two-sided').
If the score is below 0.05, it means that the changes observed in the metric are likely not due to chance.
What does 'No Test Conducted' Mean?
If you see a result marked as no test conducted, it means the analysis couldn’t be done. This usually happens when the data samples are too similar or don't show enough variation to conduct a meaningful analysis.
Alert on data in Graphite
The actual score is automatically sent to Graphite for each metric, which makes it possible to create alert rules in Grafana to alert on regressions. Documentation on how to do that will come soon.