Documentation / F.A.Q. and Best Practice
F.A.Q and Best Practice
Here we keep questions that are frequently asked on Slack or GitHub.
Running tests
Read this before you start to collect metrics.
How do I test cached pages?
The easiest way is to use the --preURL parameter:
docker run --rm -v "$(pwd):/sitespeed.io" sitespeedio/sitespeed.io:42.0.1 --preURL https://www.sitespeed.io/documentation/ https://www.sitespeed.io/In the example, the browser will first go to https://www.sitespeed.io/documentation/ and then navigate with a primed cache to https://www.sitespeed.io/. You can also use scripting if you don't mind writing code.
How do I set a cookie?
You can add a cookie by using --cookie name=value where the name is the name of the cookie and the value ... the value :) The cookie will be set on the domain that you test. You can also use --requestheader to set the cookie in the request header. If you use Chrome, you can also use the Chrome DevTools Protocol in scripting for more complicated use cases.
How do I test multiple pages in the same run?
If you want to test multiple URLs, you can line them up on the CLI:
docker run --rm -v "$(pwd):/sitespeed.io" sitespeedio/sitespeed.io:42.0.1 https://www.sitespeed.io https://www.sitespeed.io/documentation/You can also use a plain text file with one URL on each line. Create a file called urls.txt (but you can call it whatever you want):
http://www.yoursite.com/path/
http://www.yoursite.com/my/really/important/page/
http://www.yoursite.com/where/we/are/
Another feature of the plain text file is that you can add aliases after each URL. To do this, add a non-spaced string after each URL that you would like to alias:
http://www.yoursite.com/ Start_page
http://www.yoursite.com/my/really/important/page/ Important_Page
http://www.yoursite.com/where/we/are/ We_are
And then you feed the file to sitespeed.io:
docker run --rm -v "$(pwd):/sitespeed.io" sitespeedio/sitespeed.io:42.0.1 urls.txtHow many runs should I do on the same page to get stable metrics?
How many runs depends on your site, and what you want to collect. Pat told us about how he is doing five runs when testing for Chrome. Hitting a URL 3-5 times is often ok when you want to fetch timing metrics, but increasing to 7-11 can give better values. Start low and if you see a lot of variations between runs, increase until you get some solid values.
Getting timing metrics is one thing, but it's also important to collect how your page is built. You need to keep track of the size of pages, how much synchronously loaded JavaScript you have, and so on. For that kind of information you only need one run per URL.
You should also try out our new setup with WebPageReplay.
I want to test a user journey (multiple pages), how do I do that?
Check out the scripting capabilities that make it easy to test multiple pages.
I want to test on different CPU speeds, how do I do that?
If you use Chrome you can use --chrome.CPUThrottlingRate. However, there's a bug in ChromeDriver so this only works if you run with the --headless parameter.
Throttle or not throttle your connection?
PLEASE, YOU NEED TO ALWAYS THROTTLE YOUR CONNECTION! You should always throttle/limit the connectivity because it makes it easier for you to find regressions. If you don't, your tests will run with different connectivity profiles and any regressions/improvements you see may just be caused by your server's flaky internet connection. Check out our connectivity guide.
Clear browser cache between runs
By default Browsertime creates a new profile for each iteration you do, meaning the cache is cleared through the WebDriver. If you really want to be sure everything is cleared between runs, you can use our WebExtension to clear the browser cache by adding --browsertime.cacheClearRaw.
That means if you test https://www.sitespeed.io with 5 runs/iterations, the browser cache is cleared between each run, so the browser has no cached assets between runs.
When you run --preURL the browser starts, then accesses the preURL and then the URL you want to test within the same session, without clearing the cache. Use this if you want to measure more realistic metrics where your user first hits your start page and then another page (with responses in the cache if the URL has the correct cache headers).
If you use the --preScript or --multi feature it is the same behaviour: we don't clear the cache between the URLs you want to test.
My pre/post/scripting script doesn't work?
You can read more about our pre/post script setup, and check the Debugging scripts tutorial if you have any problems.
If you have a problem with Selenium (getting the right element etc.), PLEASE do not create issues in sitespeed.io. Head over to the Selenium community and they can help you.
How do you pass HTML/JavaScript as a CLI parameter?
The easiest way to pass HTML to the CLI is to pass on the whole message as a String (use a quotation mark to start and end the String) and then do not use quotation marks inside the HTML.
Say that you want to pass on your own link as an annotation message, then do like this:
--graphite.annotationMessage "TEXT <a href='https://github.com/***' target='blank'>link-text</a>"
If you need to debug CLI parameters, the best way is to turn on verbose logging. Do that by adding -vv to your run and check the log for the message that starts with Config options. Then you will see all parameters that get passed from the CLI to sitespeed.io and how they are interpreted.
I want JSON from Browsertime, Coach or other tools, how do I get that?
There's a plugin bundled with sitespeed.io called the analysisstorer plugin that isn't enabled by default. It stores the original JSON data from all analyzers (from Browsertime, Coach data, WebPageTest etc.) to disk. You can enable this plugin:
docker run --rm -v "$(pwd):/sitespeed.io" sitespeedio/sitespeed.io:42.0.1 https://www.sitespeed.io --plugins.add analysisstorerThe JSON files for the whole run (summary files) will end up in $RESULT/data/. JSON for each individual page is stored in $RESULT/data/pages/$PAGE/data/.
How do I test pages with #-URLs?
By default, the # part of a URL is stripped off from your page. Yep we know, it isn't the best, but in the old days the # rarely added any value and crawling a site linking to the same page with different sections made you test the same page over and over again.
If you have pages that are generated differently depending on what's after the #-sign, you can use the --useHash switch. Then each page will be tested as a unique page.
docker run --rm -v "$(pwd):/sitespeed.io" sitespeedio/sitespeed.io:42.0.1 --useHash https://www.sitespeed.io/#/superYou can also use the --urlAlias if you want to give the page a friendly name. Use it multiple times if you have multiple URLs.
docker run --rm -v "$(pwd):/sitespeed.io" sitespeedio/sitespeed.io:42.0.1 --useHash --urlAlias super --urlAlias duper https://www.sitespeed.io/#/super https://www.sitespeed.io/#/duperHow do I test single point of failure (SPOF)?
You can use the domain unreachable.sitespeed.io, which you can connect to but which will be really slow.
For example, say you have a website that loads assets from cdn1.readspeaker.com inside the head tag and you want to test what happens if that domain is really slow. You can do that using Chrome by adding this argument.
--chrome.args='--host-resolver-rules=MAP cdn1.readspeaker.com unreachable.sitespeed.io'That will make all requests that would use cdn1.readspeaker.com instead access unreachable.sitespeed.io, which slows everything down.
Running tests from multiple locations
Can I test the same URLs from different locations, and how do I make sure they don't override each other's data in Graphite?
You should set different namespaces depending on location (--graphite.namespace). If you run one test from London, set the namespace to --graphite.namespace sitespeed_io.london. Then you can choose individual locations in the dropdown in the pre-made dashboards.
Google Web Vitals
To get Google's Web Vitals in your tests you need to use Chrome. Sitespeed.io collects: First Contentful Paint, Largest Contentful Paint, Cumulative Layout Shift, Interaction to Next Paint, and Total Blocking Time (a lab proxy for INP/FID).
A good thing is to calibrate your test against the Chrome User Experience report data. Do that by running the CrUx plugin, then tuning the connectivity setting you use and comparing First and Largest Contentful Paint.
To calibrate Cumulative Layout Shift, use scripting to drive the page (e.g. scroll) so layout shifts that happen post-load are captured.
Total Blocking Time is harder. The best way is to test on a real mobile phone, preferably an older Android phone like a Moto G5. INP needs real interactions — drive them via scripting.
Google Page Speed Insights vs Lighthouse vs Chrome User Experience Report plugins
It's a little bit confusing, what tool should you use and how do they work? The Google Page Speed Insights plugin runs Lighthouse on Google's servers and also collects Chrome User Experience data. If you run the Lighthouse plugin, Lighthouse will run on your own machine. The Chrome User Experience Report plugin collects data from the CrUx API, which is collected from real Chrome users who access the website AND have the sync feature turned on in Chrome (= allowing Google to collect the metrics).
Store the data
By default you can choose to store your metrics in a time series database (Graphite or InfluxDB).
Should I choose Graphite or InfluxDB?
If your organisation is running Graphite, use that. If you're used to InfluxDB, use that. If you don't use any of them then use Graphite since we have more ready made dashboards for Graphite.
Handling large amounts of data
sitespeed.io will generate lots of metrics and data, how do I handle that?
Configuring features
If you want to store less data from sitespeed.io, one way is to configure and compress data more.
The heaviest data that sitespeed.io generates is the video, screenshot and video filmstrip screenshots. You can disable those features but it will make it harder for you to verify that everything works ok and to pinpoint regressions.
If you have limited space (and do not store the data on S3 or in GCS and configure it to automatically remove old data) you can use the following configurations.
Video
You can change the Constant rate factor. Default is 23. If you change that you can have videos with lower quality but it will take less space. Use --browsertime.videoParams.crf.
You can also change the quality of the video filmstrip screenshots. Default it is set to 75 but you can set a value between 0 - 100. Use --browsertime.videoParams.filmstripQuality.
If you don't use the filmstrip (at the moment the filmstrip screenshots aren't used within the sitespeed.io result pages) you can disable it. --browsertime.videoParams.createFilmstrip false will disable the filmstrip.
Screenshot
If you want to decrease the size of the screenshots, you should first enable screenshots with jpg instead of png. --screenshot.type jpg will do that.
You can then also set the jpg quality. Default is 80 but you can set the value between 0-100. Use --screenshot.jpg.quality.
As a last thing: you can set the max size of the screenshot (in pixels, max in both width and height). Default is 2000, meaning the screenshot will probably be full sized (depending on how you configured your viewport). Change it with --screenshot.maxSize.
Disabling features/plugins
Another alternative to minimize the amount of data is to disable plugins. You should be really careful doing that since it will make it harder for you to verify that everything works ok and to pinpoint regressions.
You can list which plugins are running by adding the flag --plugins.list and in the log you will see something like:
INFO: The following plugins are enabled: assets, browsertime, budget, coach, domains, harstorer, html, lateststorer, metrics, pagexray, remove, text, thirdparty, tracestorer
If you want to disable the screenshots (that are stored to disk) you do that by adding --browsertime.screenshot false.
Graphite
Make sure to edit your storage-schemas.conf to match your metrics and how long you want to keep them. See Graphite setup in production.
S3 and GCS
When you create your buckets at S3 or GCS, you can configure how long it will keep your data (HTML/screenshots/videos). Make it match how long you keep your metrics in Graphite, or how far back in time you think you need it. Usually that's shorter than you think :) When you find a regression (hopefully within an hour, or at least a day), you want to compare that data with what it looked like before. Storing things in the bucket for 2 weeks should be OK, but it's up to you.
Alerting
We've been trying out alerts in Grafana for a while and it works really well for us. Check out the alert section in the docs.
Difference in metrics between WebPageTest and sitespeed.io
Now and then an issue pops up on GitHub asking why some metrics differ between WebPageTest and sitespeed.io.
There are a couple of things to know that differ between WebPageTest and Browsertime/sitespeed.io. But first I want to say that it is wrong to compare between tools, it is right to continuously compare within the same tool to find regressions :)
WPT and sitespeed.io differ by default in when they end tests. WPT ends when there hasn't been any network traffic for 2 seconds (if I remember correctly). sitespeed.io ends 2 seconds after loadEventEnd. Both tools are configurable.
And a couple of generic things that will make your metrics differ:
- Connectivity matters - You need to set the connectivity.
- CPU matters - Running the same tests with the same tool on different machines will give different results.
- Your page matters - It could happen that your page has different sweet spots on connectivity (that make the page render faster) so even a small change will make the page much slower (we have that scenario on Wikipedia).
Difference in metrics between sitespeed.io and https://pagespeed.web.dev
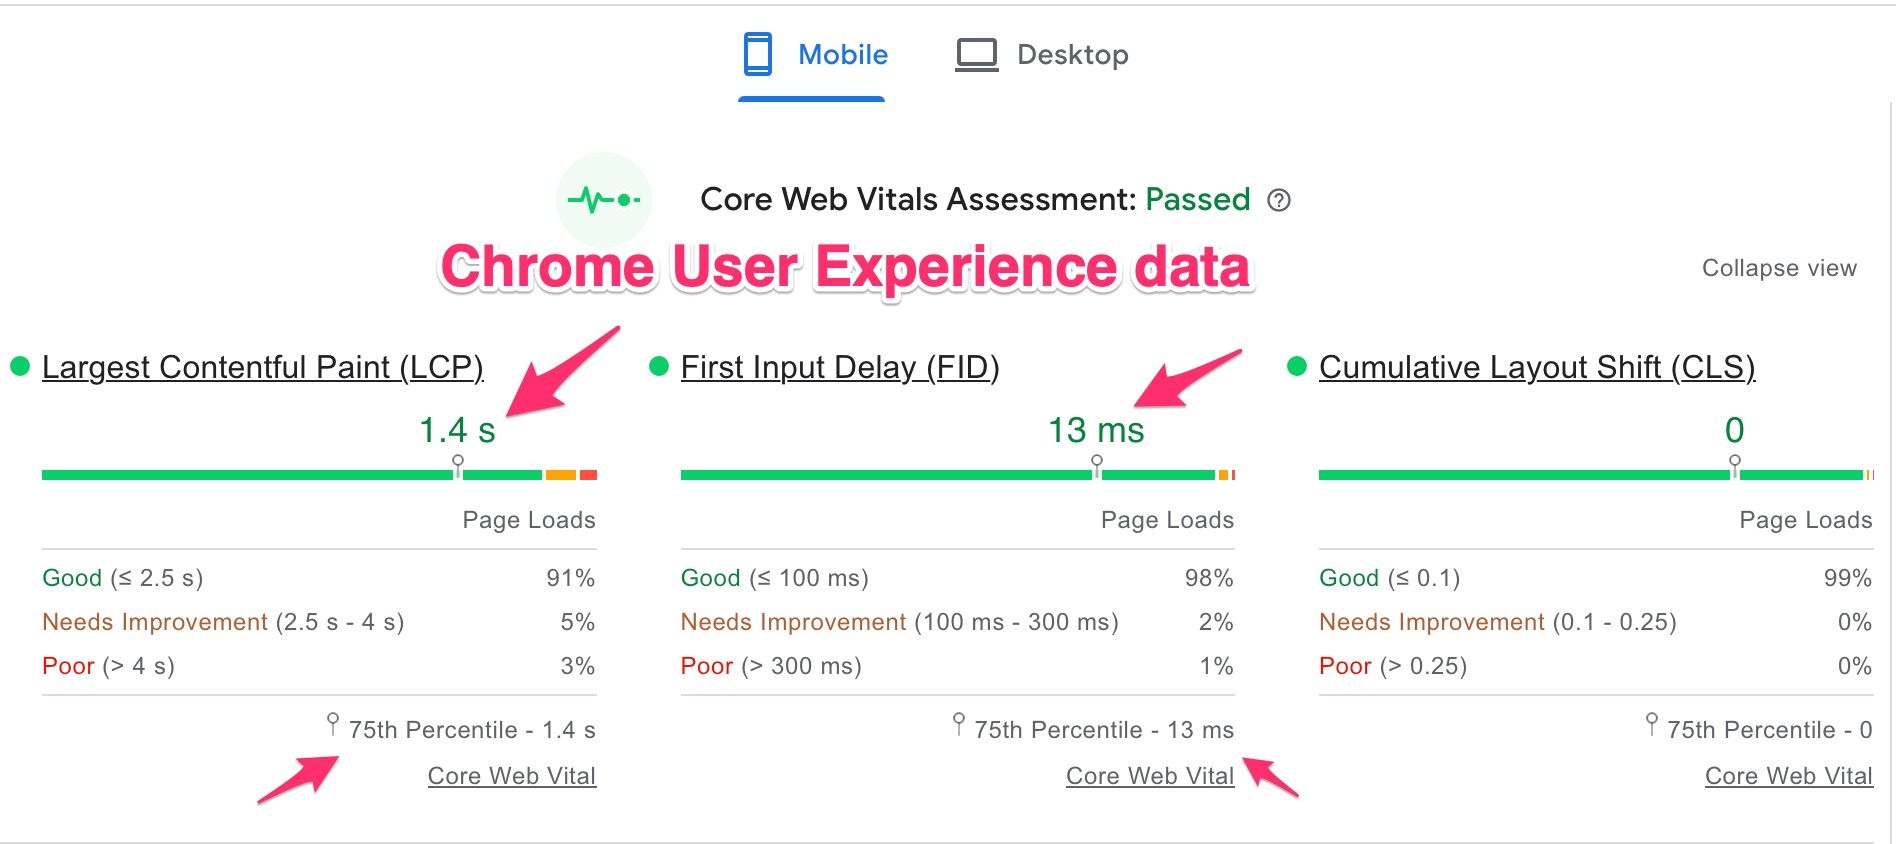
When analyzing web performance data, it's important to understand the source and context of the metrics. The data from the Chrome User Experience Report represents metrics collected by Chrome from users who "consented" to share their browsing data. This report reflects the 75th percentile of user experiences, meaning that for the given metric, 75% of the sampled users experienced that performance level or better. For instance, in the example below, 75% of users had a Largest Contentful Paint (LCP) faster than 1.4 seconds, across various devices and network conditions.
Is this data useful? Absolutely, especially if you don’t have your own real user monitoring (RUM) metrics. However, it's important to note that this data is limited to Chrome users who agreed to data collection, potentially skewing the metrics if your audience uses a broader range of browsers like Safari, Edge, or Firefox.
To optimize your sitespeed.io tests, use these insights to mirror the experiences of the 75th percentile of your user base. For example, you can adjust network throttling in sitespeed.io to match the Time to First Byte (TTFB) reported in the Chrome data. Then, compare First Contentful Paint (FCP) and LCP metrics. If they don't align, consider adjusting CPU throttling, or better yet, test on actual mobile devices. More information on CPU benchmarking for testing, such as with Wikipedia, can be found here.
sitespeed.io even offers a Chrome User Experience Report plugin that lets you directly pull this data from Google for comparison with your sitespeed.io results.
In summary, consider this approach:
- If you have your own RUM metrics, use them to calibrate your sitespeed.io tests.
- If not, leverage the Chrome User Experience data, keeping in mind its potential limitations, to guide your testing and optimization efforts.